

Poverty and Human Development Report 2009 - UNDP in Tanzania
Poverty and Human Development Report 2009 - UNDP in Tanzania
Poverty and Human Development Report 2009 - UNDP in Tanzania

Create successful ePaper yourself
Turn your PDF publications into a flip-book with our unique Google optimized e-Paper software.
POVERTY AND HUMAN DEVELOPMENT REPORT <strong>2009</strong><br />
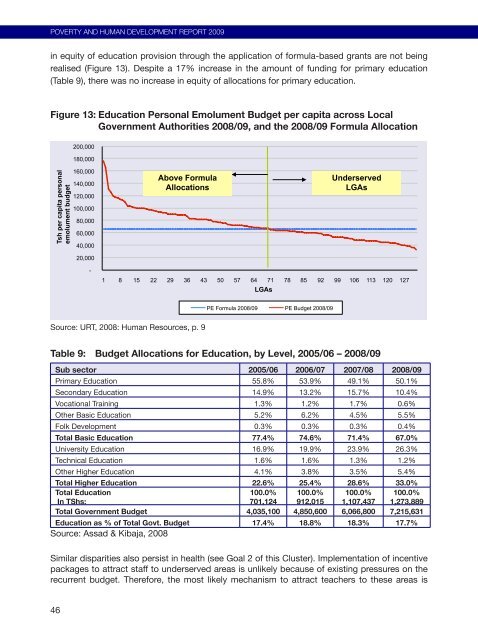
<strong>in</strong> equity of education provision through the application of formula-based grants are not be<strong>in</strong>g<br />
realised (Figure 13). Despite a 17% <strong>in</strong>crease <strong>in</strong> the amount of fund<strong>in</strong>g for primary education<br />
(Table 9), there was no <strong>in</strong>crease <strong>in</strong> equity of allocations for primary education.<br />
Figure 13: Education Personal Emolument Budget per capita across Local<br />
Government Authorities 2008/09, <strong>and</strong> the 2008/09 Formula Allocation<br />
Tsh per capita personal<br />
emolument budget<br />
46<br />
200,000<br />
180,000<br />
160,000<br />
140,000<br />
120,000<br />
100,000<br />
80,000<br />
60,000<br />
40,000<br />
20,000<br />
-<br />
Above Formula<br />
Allocations<br />
1 8 15 22 29 36 43 50 57 64 71 78 85 92 99 106 113 120 127<br />
LGAs<br />
Source: URT, 2008: <strong>Human</strong> Resources, p. 9<br />
PE Formula 2008/09 PE Budget 2008/09<br />
Underserved<br />
LGAs<br />
Table 9: Budget Allocations for Education, by Level, 2005/06 – 2008/09<br />
Sub sector 2005/06 2006/07 2007/08 2008/09<br />
Primary Education 55.8% 53.9% 49.1% 50.1%<br />
Secondary Education 14.9% 13.2% 15.7% 10.4%<br />
Vocational Tra<strong>in</strong><strong>in</strong>g 1.3% 1.2% 1.7% 0.6%<br />
Other Basic Education 5.2% 6.2% 4.5% 5.5%<br />
Folk <strong>Development</strong> 0.3% 0.3% 0.3% 0.4%<br />
Total Basic Education 77.4% 74.6% 71.4% 67.0%<br />
University Education 16.9% 19.9% 23.9% 26.3%<br />
Technical Education 1.6% 1.6% 1.3% 1.2%<br />
Other Higher Education 4.1% 3.8% 3.5% 5.4%<br />
Total Higher Education 22.6% 25.4% 28.6% 33.0%<br />
Total Education<br />
100.0% 100.0% 100.0% 100.0%<br />
In TShs:<br />
701,124 912,015 1,107,437 1,273,889<br />
Total Government Budget 4,035,100 4,850,600 6,066,800 7,215,631<br />
Education as % of Total Govt. Budget<br />
Source: Assad & Kibaja, 2008<br />
17.4% 18.8% 18.3% 17.7%<br />
Similar disparities also persist <strong>in</strong> health (see Goal 2 of this Cluster). Implementation of <strong>in</strong>centive<br />
packages to attract staff to underserved areas is unlikely because of exist<strong>in</strong>g pressures on the<br />
recurrent budget. Therefore, the most likely mechanism to attract teachers to these areas is


