

Poverty and Human Development Report 2009 - UNDP in Tanzania
Poverty and Human Development Report 2009 - UNDP in Tanzania
Poverty and Human Development Report 2009 - UNDP in Tanzania

Create successful ePaper yourself
Turn your PDF publications into a flip-book with our unique Google optimized e-Paper software.
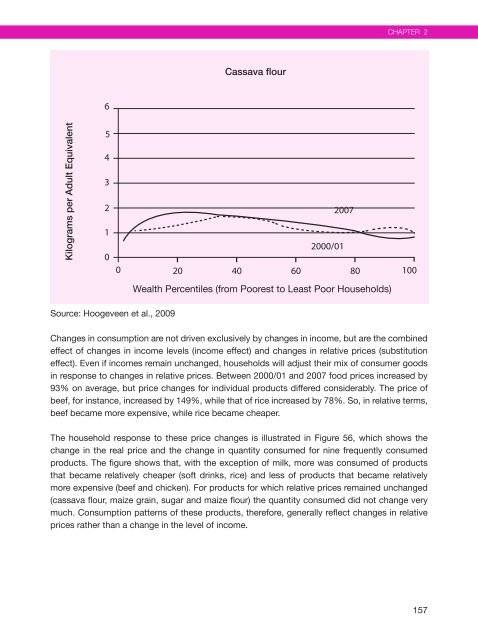
Kilograms per Adult Equivalent<br />
6<br />
5<br />
4<br />
3<br />
2<br />
1<br />
0<br />
source: hoogeveen et al., <strong>2009</strong><br />
Cassava flour<br />
2007<br />
2000/01<br />
0 20 40 60 80 100<br />
Wealth Percentiles (from Poorest to Least Poor Households)<br />
Chapter 2<br />
Changes <strong>in</strong> consumption are not driven exclusively by changes <strong>in</strong> <strong>in</strong>come, but are the comb<strong>in</strong>ed<br />
effect of changes <strong>in</strong> <strong>in</strong>come levels (<strong>in</strong>come effect) <strong>and</strong> changes <strong>in</strong> relative prices (substitution<br />
effect). even if <strong>in</strong>comes rema<strong>in</strong> unchanged, households will adjust their mix of consumer goods<br />
<strong>in</strong> response to changes <strong>in</strong> relative prices. Between 2000/01 <strong>and</strong> 2007 food prices <strong>in</strong>creased by<br />
93% on average, but price changes for <strong>in</strong>dividual products differed considerably. the price of<br />
beef, for <strong>in</strong>stance, <strong>in</strong>creased by 149%, while that of rice <strong>in</strong>creased by 78%. so, <strong>in</strong> relative terms,<br />
beef became more expensive, while rice became cheaper.<br />
the household response to these price changes is illustrated <strong>in</strong> figure 56, which shows the<br />
change <strong>in</strong> the real price <strong>and</strong> the change <strong>in</strong> quantity consumed for n<strong>in</strong>e frequently consumed<br />
products. the figure shows that, with the exception of milk, more was consumed of products<br />
that became relatively cheaper (soft dr<strong>in</strong>ks, rice) <strong>and</strong> less of products that became relatively<br />
more expensive (beef <strong>and</strong> chicken). for products for which relative prices rema<strong>in</strong>ed unchanged<br />
(cassava flour, maize gra<strong>in</strong>, sugar <strong>and</strong> maize flour) the quantity consumed did not change very<br />
much. Consumption patterns of these products, therefore, generally reflect changes <strong>in</strong> relative<br />
prices rather than a change <strong>in</strong> the level of <strong>in</strong>come.<br />
157


