

Poverty and Human Development Report 2009 - UNDP in Tanzania
Poverty and Human Development Report 2009 - UNDP in Tanzania
Poverty and Human Development Report 2009 - UNDP in Tanzania

You also want an ePaper? Increase the reach of your titles
YUMPU automatically turns print PDFs into web optimized ePapers that Google loves.
the poverty l<strong>in</strong>e basket was valued us<strong>in</strong>g prices collected <strong>in</strong> the 2000/01 survey. At that time the<br />
poverty l<strong>in</strong>e was tshs 7,253. Between 2000/01 <strong>and</strong> 2007, prices of goods <strong>and</strong> services <strong>in</strong> the<br />
basket <strong>in</strong>creased by 93%, so the poverty l<strong>in</strong>e <strong>in</strong> 2007 is tshs 13,998.<br />
table 36 presents results for three st<strong>and</strong>ard measures for poverty:<br />
i) poverty headcount, i.e., the percentage of the population below the poverty l<strong>in</strong>e;<br />
ii) poverty gap, which takes <strong>in</strong>to account how far below the poverty l<strong>in</strong>e a person is located;<br />
<strong>and</strong><br />
iii) poverty gap squared or poverty severity which gives additional weight to people further<br />
below the poverty l<strong>in</strong>e.<br />
Between 2000/01 <strong>and</strong> 2007, all three <strong>in</strong>dicators decl<strong>in</strong>ed, but only marg<strong>in</strong>ally. the poverty<br />
headcount <strong>in</strong> tanzania Ma<strong>in</strong>l<strong>and</strong> fell by just over 2 percentage po<strong>in</strong>ts from 35.7% <strong>in</strong> 2000/01<br />
to 33.6% <strong>in</strong> 2007. the reduction <strong>in</strong> headcount poverty by area of residence is even smaller:<br />
1.2 percentage po<strong>in</strong>ts <strong>in</strong> dar es salaam, 1.7 percentage po<strong>in</strong>ts <strong>in</strong> other urban areas <strong>and</strong> 1.1<br />
percentage po<strong>in</strong>ts <strong>in</strong> rural areas. 96 Given that the poverty headcount fell only slightly while the<br />
population cont<strong>in</strong>ued to grow, the absolute number of poor tanzanians <strong>in</strong>creased by 1.3 million<br />
between 2000/01 <strong>and</strong> 2007. 97 With a population projected to be 38.3 million <strong>in</strong> Ma<strong>in</strong>l<strong>and</strong> tanzania<br />
<strong>in</strong> 2007, the total number of poor people is estimated to be 12.9 million.<br />
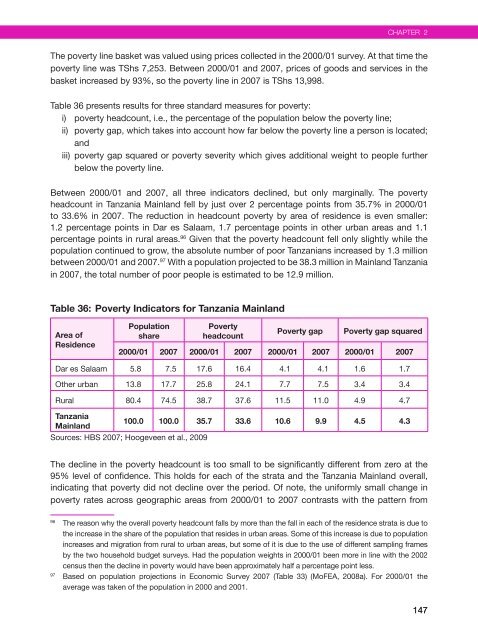
Table 36: <strong>Poverty</strong> Indicators for <strong>Tanzania</strong> Ma<strong>in</strong>l<strong>and</strong><br />
Area of<br />
Residence<br />
Population<br />
share<br />
<strong>Poverty</strong><br />
headcount<br />
Chapter 2<br />
<strong>Poverty</strong> gap <strong>Poverty</strong> gap squared<br />
2000/01 2007 2000/01 2007 2000/01 2007 2000/01 2007<br />
dar es salaam 5.8 7.5 17.6 16.4 4.1 4.1 1.6 1.7<br />
other urban 13.8 17.7 25.8 24.1 7.7 7.5 3.4 3.4<br />
rural 80.4 74.5 38.7 37.6 11.5 11.0 4.9 4.7<br />
<strong>Tanzania</strong><br />
Ma<strong>in</strong>l<strong>and</strong><br />
100.0 100.0 35.7 33.6 10.6 9.9 4.5 4.3<br />
sources: hBs 2007; hoogeveen et al., <strong>2009</strong><br />
the decl<strong>in</strong>e <strong>in</strong> the poverty headcount is too small to be significantly different from zero at the<br />
95% level of confidence. this holds for each of the strata <strong>and</strong> the tanzania Ma<strong>in</strong>l<strong>and</strong> overall,<br />
<strong>in</strong>dicat<strong>in</strong>g that poverty did not decl<strong>in</strong>e over the period. of note, the uniformly small change <strong>in</strong><br />
poverty rates across geographic areas from 2000/01 to 2007 contrasts with the pattern from<br />
96 the reason why the overall poverty headcount falls by more than the fall <strong>in</strong> each of the residence strata is due to<br />
the <strong>in</strong>crease <strong>in</strong> the share of the population that resides <strong>in</strong> urban areas. some of this <strong>in</strong>crease is due to population<br />
<strong>in</strong>creases <strong>and</strong> migration from rural to urban areas, but some of it is due to the use of different sampl<strong>in</strong>g frames<br />
by the two household budget surveys. had the population weights <strong>in</strong> 2000/01 been more <strong>in</strong> l<strong>in</strong>e with the 2002<br />
census then the decl<strong>in</strong>e <strong>in</strong> poverty would have been approximately half a percentage po<strong>in</strong>t less.<br />
97 Based on population projections <strong>in</strong> economic survey 2007 (table 33) (MofeA, 2008a). for 2000/01 the<br />
average was taken of the population <strong>in</strong> 2000 <strong>and</strong> 2001.<br />
147


