

Poverty and Human Development Report 2009 - UNDP in Tanzania
Poverty and Human Development Report 2009 - UNDP in Tanzania
Poverty and Human Development Report 2009 - UNDP in Tanzania

You also want an ePaper? Increase the reach of your titles
YUMPU automatically turns print PDFs into web optimized ePapers that Google loves.
Pupil/Teacher Ratio<br />
Overall, the pupil:teacher ratio <strong>in</strong> <strong>2009</strong> rema<strong>in</strong>s at 54:1, <strong>and</strong> reach<strong>in</strong>g the MKUKUTA target of<br />
45:1 looks <strong>in</strong>creas<strong>in</strong>gly unlikely. The rapid expansion of secondary education is creat<strong>in</strong>g strong<br />
budgetary pressures which will impact additional recruitment of primary teachers.<br />
Pupil/Text Book Ratio<br />
No new data are available, but the Annual Sector Review on Education <strong>in</strong> 2008 expressed serious<br />
concern that the textbook procurement <strong>and</strong> distribution system is not work<strong>in</strong>g well. Compla<strong>in</strong>ts<br />
were raised about the high numbers of books left un-purchased or <strong>in</strong> storage while, at the same<br />
time, ‘pirated’, poor quality copies of approved books are be<strong>in</strong>g used <strong>in</strong> schools.’ 30<br />
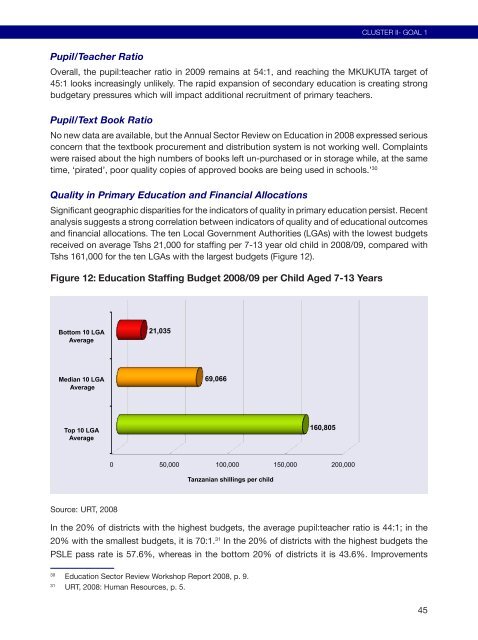
Quality <strong>in</strong> Primary Education <strong>and</strong> F<strong>in</strong>ancial Allocations<br />
Significant geographic disparities for the <strong>in</strong>dicators of quality <strong>in</strong> primary education persist. Recent<br />
analysis suggests a strong correlation between <strong>in</strong>dicators of quality <strong>and</strong> of educational outcomes<br />
<strong>and</strong> f<strong>in</strong>ancial allocations. The ten Local Government Authorities (LGAs) with the lowest budgets<br />
received on average Tshs 21,000 for staff<strong>in</strong>g per 7-13 year old child <strong>in</strong> 2008/09, compared with<br />
Tshs 161,000 for the ten LGAs with the largest budgets (Figure 12).<br />
Figure 12: Education Staff<strong>in</strong>g Budget 2008/09 per Child Aged 7-13 Years<br />
Bottom 10 LGA<br />
Average<br />
Median 10 LGA<br />
Average<br />
Top 10 LGA<br />
Average<br />
Source: URT, 2008<br />
21,035<br />
69,066<br />
160,805<br />
0 50,000 100,000 150,000 200,000<br />
<strong>Tanzania</strong>n shill<strong>in</strong>gs per child<br />
In the 20% of districts with the highest budgets, the average pupil:teacher ratio is 44:1; <strong>in</strong> the<br />
20% with the smallest budgets, it is 70:1. 31 In the 20% of districts with the highest budgets the<br />
PSLE pass rate is 57.6%, whereas <strong>in</strong> the bottom 20% of districts it is 43.6%. Improvements<br />
30 Education Sector Review Workshop <strong>Report</strong> 2008, p. 9.<br />
31 URT, 2008: <strong>Human</strong> Resources, p. 5.<br />
CLUSTER II- GOAL 1<br />
45


