

Poverty and Human Development Report 2009 - UNDP in Tanzania
Poverty and Human Development Report 2009 - UNDP in Tanzania
Poverty and Human Development Report 2009 - UNDP in Tanzania

Create successful ePaper yourself
Turn your PDF publications into a flip-book with our unique Google optimized e-Paper software.
GDP Growth by Sector<br />
the pr<strong>in</strong>cipal theories of economic transformation recognise that the share of the agricultural<br />
sector will contract with national development, leav<strong>in</strong>g space for expansion of the <strong>in</strong>dustrial<br />
<strong>and</strong> service sectors. analysis of sectoral contributions to tanzanian gdP s<strong>in</strong>ce 1998 <strong>in</strong>dicates<br />
modest structural change (figure 2). services constitute the largest sector <strong>in</strong> the economy,<br />
<strong>and</strong> the sector’s share <strong>in</strong> total gdP has <strong>in</strong>creased slightly from 45% <strong>in</strong> 1998 to almost 48% <strong>in</strong><br />
2008. with<strong>in</strong> this sector, ‘trade <strong>and</strong> repairs’ together with ‘real estate <strong>and</strong> bus<strong>in</strong>ess services’<br />
are the major contributors. the contribution of construction <strong>and</strong> m<strong>in</strong><strong>in</strong>g to gdP also <strong>in</strong>creased<br />
from around 7% to 9% over the same period. while the agricultural sector rema<strong>in</strong>s central to<br />
tanzania’s economy, its contribution to gdP (exclud<strong>in</strong>g fish<strong>in</strong>g) has dropped by 6 percentage<br />
po<strong>in</strong>ts from around 30% <strong>in</strong> 1998 to approximately 24% <strong>in</strong> 2008.<br />
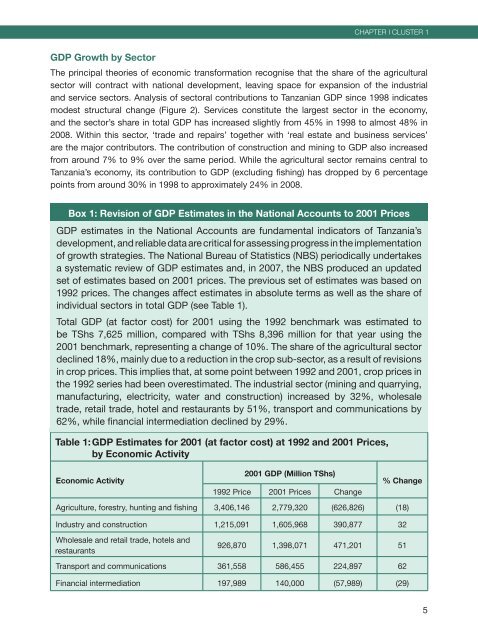
Box 1: Revision of GDP Estimates <strong>in</strong> the National Accounts to 2001 Prices<br />
gdP estimates <strong>in</strong> the national accounts are fundamental <strong>in</strong>dicators of tanzania’s<br />
development, <strong>and</strong> reliable data are critical for assess<strong>in</strong>g progress <strong>in</strong> the implementation<br />
of growth strategies. the national bureau of statistics (nbs) periodically undertakes<br />
a systematic review of gdP estimates <strong>and</strong>, <strong>in</strong> 2007, the nbs produced an updated<br />
set of estimates based on 2001 prices. the previous set of estimates was based on<br />
1992 prices. the changes affect estimates <strong>in</strong> absolute terms as well as the share of<br />
<strong>in</strong>dividual sectors <strong>in</strong> total gdP (see table 1).<br />
total gdP (at factor cost) for 2001 us<strong>in</strong>g the 1992 benchmark was estimated to<br />
be tshs 7,625 million, compared with tshs 8,396 million for that year us<strong>in</strong>g the<br />
2001 benchmark, represent<strong>in</strong>g a change of 10%. the share of the agricultural sector<br />
decl<strong>in</strong>ed 18%, ma<strong>in</strong>ly due to a reduction <strong>in</strong> the crop sub-sector, as a result of revisions<br />
<strong>in</strong> crop prices. this implies that, at some po<strong>in</strong>t between 1992 <strong>and</strong> 2001, crop prices <strong>in</strong><br />
the 1992 series had been overestimated. the <strong>in</strong>dustrial sector (m<strong>in</strong><strong>in</strong>g <strong>and</strong> quarry<strong>in</strong>g,<br />
manufactur<strong>in</strong>g, electricity, water <strong>and</strong> construction) <strong>in</strong>creased by 32%, wholesale<br />
trade, retail trade, hotel <strong>and</strong> restaurants by 51%, transport <strong>and</strong> communications by<br />
62%, while f<strong>in</strong>ancial <strong>in</strong>termediation decl<strong>in</strong>ed by 29%.<br />
Table 1: GDP Estimates for 2001 (at factor cost) at 1992 <strong>and</strong> 2001 Prices,<br />
by Economic Activity<br />
Economic Activity<br />
2001 GDP (Million TShs)<br />
1992 Price 2001 Prices change<br />
% Change<br />
agriculture, forestry, hunt<strong>in</strong>g <strong>and</strong> fish<strong>in</strong>g 3,406,146 2,779,320 (626,826) (18)<br />
<strong>in</strong>dustry <strong>and</strong> construction 1,215,091 1,605,968 390,877 32<br />
wholesale <strong>and</strong> retail trade, hotels <strong>and</strong><br />
restaurants<br />
Chapter I CLUSter 1<br />
926,870 1,398,071 471,201 51<br />
transport <strong>and</strong> communications 361,558 586,455 224,897 62<br />
f<strong>in</strong>ancial <strong>in</strong>termediation 197,989 140,000 (57,989) (29)<br />
5


