

Poverty and Human Development Report 2009 - UNDP in Tanzania
Poverty and Human Development Report 2009 - UNDP in Tanzania
Poverty and Human Development Report 2009 - UNDP in Tanzania

You also want an ePaper? Increase the reach of your titles
YUMPU automatically turns print PDFs into web optimized ePapers that Google loves.
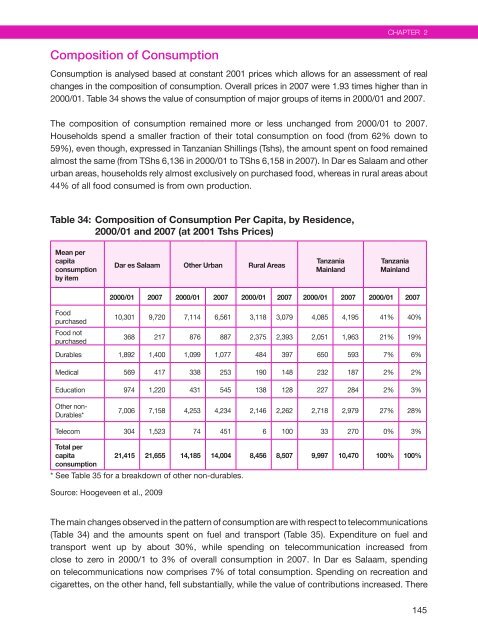
Composition of Consumption<br />
Consumption is analysed based at constant 2001 prices which allows for an assessment of real<br />
changes <strong>in</strong> the composition of consumption. overall prices <strong>in</strong> 2007 were 1.93 times higher than <strong>in</strong><br />
2000/01. table 34 shows the value of consumption of major groups of items <strong>in</strong> 2000/01 <strong>and</strong> 2007.<br />
the composition of consumption rema<strong>in</strong>ed more or less unchanged from 2000/01 to 2007.<br />
households spend a smaller fraction of their total consumption on food (from 62% down to<br />
59%), even though, expressed <strong>in</strong> tanzanian shill<strong>in</strong>gs (tshs), the amount spent on food rema<strong>in</strong>ed<br />
almost the same (from tshs 6,136 <strong>in</strong> 2000/01 to tshs 6,158 <strong>in</strong> 2007). <strong>in</strong> dar es salaam <strong>and</strong> other<br />
urban areas, households rely almost exclusively on purchased food, whereas <strong>in</strong> rural areas about<br />
44% of all food consumed is from own production.<br />
Table 34: Composition of Consumption Per Capita, by Residence,<br />
2000/01 <strong>and</strong> 2007 (at 2001 Tshs Prices)<br />
Mean per<br />
capita<br />
consumption<br />
by item<br />
food<br />
purchased<br />
food not<br />
purchased<br />
Dar es Salaam Other Urban Rural Areas<br />
<strong>Tanzania</strong><br />
Ma<strong>in</strong>l<strong>and</strong><br />
<strong>Tanzania</strong><br />
Ma<strong>in</strong>l<strong>and</strong><br />
2000/01 2007 2000/01 2007 2000/01 2007 2000/01 2007 2000/01 2007<br />
10,301 9,720 7,114 6,561 3,118 3,079 4,085 4,195 41% 40%<br />
368 217 876 887 2,375 2,393 2,051 1,963 21% 19%<br />
durables 1,892 1,400 1,099 1,077 484 397 650 593 7% 6%<br />
Medical 569 417 338 253 190 148 232 187 2% 2%<br />
education 974 1,220 431 545 138 128 227 284 2% 3%<br />
other nondurables*<br />
7,006 7,158 4,253 4,234 2,146 2,262 2,718 2,979 27% 28%<br />
telecom 304 1,523 74 451 6 100 33 270 0% 3%<br />
Total per<br />
capita<br />
consumption<br />
21,415 21,655 14,185 14,004 8,456 8,507 9,997 10,470 100% 100%<br />
* see table 35 for a breakdown of other non-durables.<br />
source: hoogeveen et al., <strong>2009</strong><br />
Chapter 2<br />
the ma<strong>in</strong> changes observed <strong>in</strong> the pattern of consumption are with respect to telecommunications<br />
(table 34) <strong>and</strong> the amounts spent on fuel <strong>and</strong> transport (table 35). expenditure on fuel <strong>and</strong><br />
transport went up by about 30%, while spend<strong>in</strong>g on telecommunication <strong>in</strong>creased from<br />
close to zero <strong>in</strong> 2000/1 to 3% of overall consumption <strong>in</strong> 2007. <strong>in</strong> dar es salaam, spend<strong>in</strong>g<br />
on telecommunications now comprises 7% of total consumption. spend<strong>in</strong>g on recreation <strong>and</strong><br />
cigarettes, on the other h<strong>and</strong>, fell substantially, while the value of contributions <strong>in</strong>creased. there<br />
145


