

Poverty and Human Development Report 2009 - UNDP in Tanzania
Poverty and Human Development Report 2009 - UNDP in Tanzania
Poverty and Human Development Report 2009 - UNDP in Tanzania

Create successful ePaper yourself
Turn your PDF publications into a flip-book with our unique Google optimized e-Paper software.
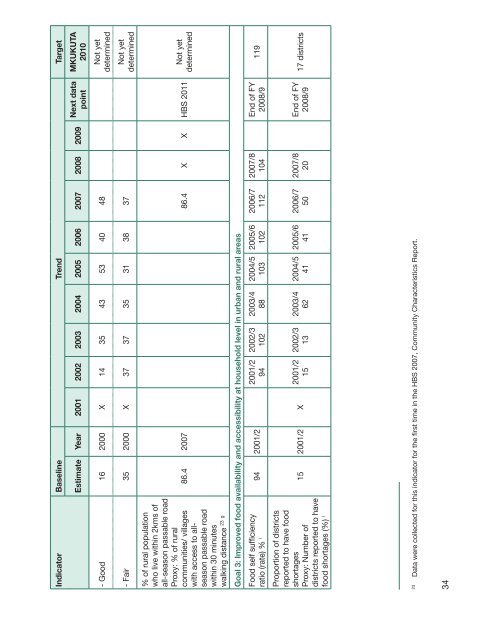
Indicator Basel<strong>in</strong>e Trend Target<br />
MKUKUTA<br />
2010<br />
Next data<br />
po<strong>in</strong>t<br />
Estimate Year 2001 2002 2003 2004 2005 2006 2007 2008 <strong>2009</strong><br />
not yet<br />
determ<strong>in</strong>ed<br />
- good 16 2000 X 14 35 43 53 40 48<br />
not yet<br />
determ<strong>in</strong>ed<br />
- fair 35 2000 X 37 37 35 31 38 37<br />
not yet<br />
determ<strong>in</strong>ed<br />
86.4 2007 86.4 X X hbs 2011<br />
119<br />
end of fY<br />
2008/9<br />
2007/8<br />
104<br />
2006/7<br />
112<br />
% of rural population<br />
who live with<strong>in</strong> 2kms of<br />
all-season passable road<br />
Proxy: % of rural<br />
communities/ villages<br />
with access to allseason<br />
passable road<br />
with<strong>in</strong> 30 m<strong>in</strong>utes<br />
23 g<br />
walk<strong>in</strong>g distance<br />
Goal 3: Improved food availability <strong>and</strong> accessibility at household level <strong>in</strong> urban <strong>and</strong> rural areas<br />
food self sufficiency<br />
ratio (rate) % i 2001/2 2002/3 2003/4 2004/5 2005/6<br />
94 2001/2<br />
94 102 88 103 102<br />
17 districts<br />
end of fY<br />
2008/9<br />
2007/8<br />
20<br />
2006/7<br />
50<br />
2005/6<br />
41<br />
2004/5<br />
41<br />
2003/4<br />
62<br />
2002/3<br />
13<br />
2001/2<br />
15<br />
15 2001/2 X<br />
Proportion of districts<br />
reported to have food<br />
shortages<br />
Proxy: number of<br />
districts reported to have<br />
food shortages (%) i<br />
23 data were collected for this <strong>in</strong>dicator for the first time <strong>in</strong> the hbs 2007, community characteristics report.<br />
34


