

Poverty and Human Development Report 2009 - UNDP in Tanzania
Poverty and Human Development Report 2009 - UNDP in Tanzania
Poverty and Human Development Report 2009 - UNDP in Tanzania

Create successful ePaper yourself
Turn your PDF publications into a flip-book with our unique Google optimized e-Paper software.
Table 13: Indicators of Malnutrition <strong>in</strong> Children Under Five Years, Urban-Rural,<br />
1999 <strong>and</strong> 2004/05<br />
1999 Ma<strong>in</strong>l<strong>and</strong><br />
Urban<br />
Rural<br />
2004/5 Ma<strong>in</strong>l<strong>and</strong><br />
Urban<br />
Rural<br />
Stunt<strong>in</strong>g (height-for-<br />
age below -2SD)<br />
44.0%<br />
26.1<br />
47.8<br />
38.0%<br />
26.0<br />
40.9<br />
Source: TRCHS 1999; TDHS 2004/05<br />
Underweight (weight-<br />
for-age below -2SD)<br />
29.5%<br />
20.7<br />
31.4<br />
21.9%<br />
17.3<br />
23.0<br />
Wast<strong>in</strong>g (weight-for-<br />
height below -2SD)<br />
5.3%<br />
5.9<br />
5.2<br />
2.9%<br />
2.9<br />
2.9<br />
Boys are marg<strong>in</strong>ally more likely to be malnourished on all three measures (stunt<strong>in</strong>g, underweight,<br />
wast<strong>in</strong>g) than girls. Rural children are more likely to be stunted (41%) than urban children (26%),<br />
<strong>and</strong> more likely to be underweight (rural 23%, urban 17%). However, the urban-rural gap narrowed<br />
between 1999 <strong>and</strong> 2004/05. A bigger drop was recorded <strong>in</strong> the proportion of rural children who<br />
were malnourished compared with their urban peers.<br />
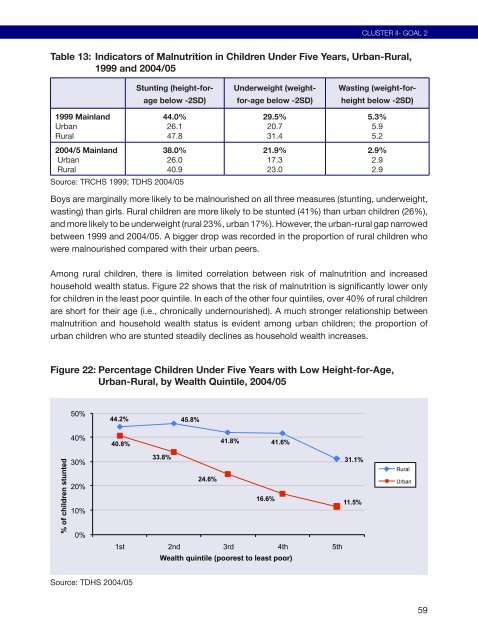
Among rural children, there is limited correlation between risk of malnutrition <strong>and</strong> <strong>in</strong>creased<br />
household wealth status. Figure 22 shows that the risk of malnutrition is significantly lower only<br />
for children <strong>in</strong> the least poor qu<strong>in</strong>tile. In each of the other four qu<strong>in</strong>tiles, over 40% of rural children<br />
are short for their age (i.e., chronically undernourished). A much stronger relationship between<br />
malnutrition <strong>and</strong> household wealth status is evident among urban children; the proportion of<br />
urban children who are stunted steadily decl<strong>in</strong>es as household wealth <strong>in</strong>creases.<br />
Figure 22: Percentage Children Under Five Years with Low Height-for-Age,<br />
Urban-Rural, by Wealth Qu<strong>in</strong>tile, 2004/05<br />
% of children stunted<br />
50%<br />
40%<br />
30%<br />
20%<br />
10%<br />
0%<br />
44.2% 45.8%<br />
40.8%<br />
Source: TDHS 2004/05<br />
33.8%<br />
24.6%<br />
41.8% 41.6%<br />
16.6%<br />
1st 2nd 3rd 4th 5th<br />
Wealth qu<strong>in</strong>tile (poorest to least poor)<br />
31.1%<br />
11.5%<br />
CLUSTER II- GOAL 2<br />
Rural<br />
Urban<br />
59


