Poverty and Human Development Report 2009 - UNDP in Tanzania
Poverty and Human Development Report 2009 - UNDP in Tanzania
Poverty and Human Development Report 2009 - UNDP in Tanzania
You also want an ePaper? Increase the reach of your titles
YUMPU automatically turns print PDFs into web optimized ePapers that Google loves.
pOVertY aND hUMaN DeVeLOpMeNt repOrt <strong>2009</strong><br />
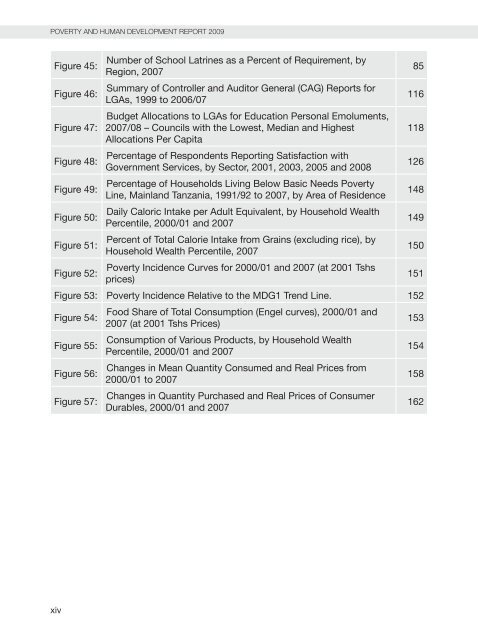
Figure 45:<br />
Figure 46:<br />
Figure 47:<br />
Figure 48:<br />
Figure 49:<br />
Figure 50:<br />
Figure 51:<br />
Figure 52:<br />
xiv<br />
Number of School Latr<strong>in</strong>es as a Percent of Requirement, by<br />
Region, 2007<br />
Summary of Controller <strong>and</strong> Auditor General (CAG) <strong>Report</strong>s for<br />
LGAs, 1999 to 2006/07<br />
Budget Allocations to LGAs for Education Personal Emoluments,<br />
2007/08 – Councils with the Lowest, Median <strong>and</strong> Highest<br />
Allocations Per Capita<br />
Percentage of Respondents <strong>Report</strong><strong>in</strong>g Satisfaction with<br />
Government Services, by Sector, 2001, 2003, 2005 <strong>and</strong> 2008<br />
Percentage of Households Liv<strong>in</strong>g Below Basic Needs <strong>Poverty</strong><br />
L<strong>in</strong>e, Ma<strong>in</strong>l<strong>and</strong> <strong>Tanzania</strong>, 1991/92 to 2007, by Area of Residence<br />
Daily Caloric Intake per Adult Equivalent, by Household Wealth<br />
Percentile, 2000/01 <strong>and</strong> 2007<br />
Percent of Total Calorie Intake from Gra<strong>in</strong>s (exclud<strong>in</strong>g rice), by<br />
Household Wealth Percentile, 2007<br />
<strong>Poverty</strong> Incidence Curves for 2000/01 <strong>and</strong> 2007 (at 2001 Tshs<br />
prices)<br />
Figure 53: <strong>Poverty</strong> Incidence Relative to the MDG1 Trend L<strong>in</strong>e. 152<br />
Figure 54:<br />
Figure 55:<br />
Figure 56:<br />
Figure 57:<br />
Food Share of Total Consumption (Engel curves), 2000/01 <strong>and</strong><br />
2007 (at 2001 Tshs Prices)<br />
Consumption of various Products, by Household Wealth<br />
Percentile, 2000/01 <strong>and</strong> 2007<br />
Changes <strong>in</strong> Mean Quantity Consumed <strong>and</strong> Real Prices from<br />
2000/01 to 2007<br />
Changes <strong>in</strong> Quantity Purchased <strong>and</strong> Real Prices of Consumer<br />
Durables, 2000/01 <strong>and</strong> 2007<br />
85<br />
116<br />
118<br />
126<br />
148<br />
149<br />
150<br />
151<br />
153<br />
154<br />
158<br />
162


