

Poverty and Human Development Report 2009 - UNDP in Tanzania
Poverty and Human Development Report 2009 - UNDP in Tanzania
Poverty and Human Development Report 2009 - UNDP in Tanzania

Create successful ePaper yourself
Turn your PDF publications into a flip-book with our unique Google optimized e-Paper software.
pOVertY aND hUMaN DeVeLOpMeNt repOrt <strong>2009</strong><br />
develop<strong>in</strong>g countries fac<strong>in</strong>g severe <strong>in</strong>stitutional <strong>and</strong> capacity constra<strong>in</strong>ts that data sources are<br />
subject to errors. ongo<strong>in</strong>g improvements <strong>in</strong> data collection <strong>and</strong> process<strong>in</strong>g will be required. 6<br />
analysis now follows on the performance of cluster i’s six support<strong>in</strong>g goals for <strong>in</strong>creas<strong>in</strong>g growth<br />
<strong>and</strong> reduc<strong>in</strong>g poverty.<br />
Goal 1 Ensur<strong>in</strong>g Sound Economic Management<br />
sound economic management promotes <strong>in</strong>vestor confidence <strong>and</strong> provides the foundation of a<br />
successful growth <strong>and</strong> poverty reduction strategy. efficiently managed budgets, tied to explicitly<br />
agreed priorities for growth are essential element of sound economic management. this goal<br />
has the follow<strong>in</strong>g <strong>in</strong>dicators:<br />
• annual rate of <strong>in</strong>flation<br />
• central government revenue as a percentage of gdP<br />
• fiscal deficit as a percentage of gdP (before <strong>and</strong> after grants)<br />
• external debt to export ratio<br />
• exports as a percentage of gdP<br />
Inflation<br />
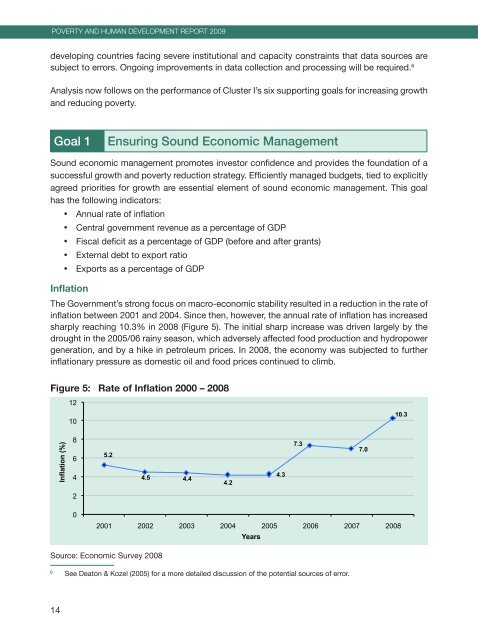
the government’s strong focus on macro-economic stability resulted <strong>in</strong> a reduction <strong>in</strong> the rate of<br />
<strong>in</strong>flation between 2001 <strong>and</strong> 2004. s<strong>in</strong>ce then, however, the annual rate of <strong>in</strong>flation has <strong>in</strong>creased<br />
sharply reach<strong>in</strong>g 10.3% <strong>in</strong> 2008 (figure 5). the <strong>in</strong>itial sharp <strong>in</strong>crease was driven largely by the<br />
drought <strong>in</strong> the 2005/06 ra<strong>in</strong>y season, which adversely affected food production <strong>and</strong> hydropower<br />
generation, <strong>and</strong> by a hike <strong>in</strong> petroleum prices. <strong>in</strong> 2008, the economy was subjected to further<br />
<strong>in</strong>flationary pressure as domestic oil <strong>and</strong> food prices cont<strong>in</strong>ued to climb.<br />
Figure 5: Rate of Inflation 2000 – 2008<br />
Inflation (%)<br />
14<br />
12<br />
10<br />
8<br />
6<br />
4<br />
2<br />
0<br />
5.2<br />
4.5 4.4<br />
4.2<br />
2001 2002 2003 2004 2005 2006 2007 2008<br />
source: economic survey 2008<br />
Years<br />
6 see deaton & Kozel (2005) for a more detailed discussion of the potential sources of error.<br />
4.3<br />
7.3<br />
7.0<br />
10.3


