

Poverty and Human Development Report 2009 - UNDP in Tanzania
Poverty and Human Development Report 2009 - UNDP in Tanzania
Poverty and Human Development Report 2009 - UNDP in Tanzania

Create successful ePaper yourself
Turn your PDF publications into a flip-book with our unique Google optimized e-Paper software.
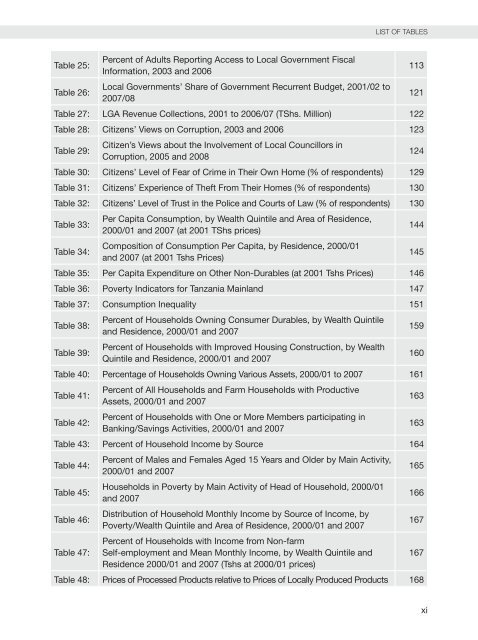
Table 25:<br />
Table 26:<br />
Percent of Adults <strong>Report</strong><strong>in</strong>g Access to Local Government Fiscal<br />
Information, 2003 <strong>and</strong> 2006<br />
Local Governments’ Share of Government Recurrent Budget, 2001/02 to<br />
2007/08<br />
Table 27: LGA Revenue Collections, 2001 to 2006/07 (TShs. Million) 122<br />
Table 28: Citizens’ views on Corruption, 2003 <strong>and</strong> 2006 123<br />
Table 29:<br />
Citizen’s views about the Involvement of Local Councillors <strong>in</strong><br />
Corruption, 2005 <strong>and</strong> 2008<br />
Table 30: Citizens’ Level of Fear of Crime <strong>in</strong> Their Own Home (% of respondents) 129<br />
Table 31: Citizens’ Experience of Theft From Their Homes (% of respondents) 130<br />
Table 32: Citizens’ Level of Trust <strong>in</strong> the Police <strong>and</strong> Courts of Law (% of respondents) 130<br />
Table 33:<br />
Table 34:<br />
Per Capita Consumption, by Wealth Qu<strong>in</strong>tile <strong>and</strong> Area of Residence,<br />
2000/01 <strong>and</strong> 2007 (at 2001 TShs prices)<br />
Composition of Consumption Per Capita, by Residence, 2000/01<br />
<strong>and</strong> 2007 (at 2001 Tshs Prices)<br />
Table 35: Per Capita Expenditure on Other Non-Durables (at 2001 Tshs Prices) 146<br />
Table 36: <strong>Poverty</strong> Indicators for <strong>Tanzania</strong> Ma<strong>in</strong>l<strong>and</strong> 147<br />
Table 37: Consumption Inequality 151<br />
Table 38:<br />
Table 39:<br />
Percent of Households Own<strong>in</strong>g Consumer Durables, by Wealth Qu<strong>in</strong>tile<br />
<strong>and</strong> Residence, 2000/01 <strong>and</strong> 2007<br />
Percent of Households with Improved Hous<strong>in</strong>g Construction, by Wealth<br />
Qu<strong>in</strong>tile <strong>and</strong> Residence, 2000/01 <strong>and</strong> 2007<br />
Table 40: Percentage of Households Own<strong>in</strong>g various Assets, 2000/01 to 2007 161<br />
Table 41:<br />
Table 42:<br />
Percent of All Households <strong>and</strong> Farm Households with Productive<br />
Assets, 2000/01 <strong>and</strong> 2007<br />
Percent of Households with One or More Members participat<strong>in</strong>g <strong>in</strong><br />
Bank<strong>in</strong>g/Sav<strong>in</strong>gs Activities, 2000/01 <strong>and</strong> 2007<br />
Table 43: Percent of Household Income by Source 164<br />
Table 44:<br />
Table 45:<br />
Table 46:<br />
Table 47:<br />
Percent of Males <strong>and</strong> Females Aged 15 Years <strong>and</strong> Older by Ma<strong>in</strong> Activity,<br />
2000/01 <strong>and</strong> 2007<br />
Households <strong>in</strong> <strong>Poverty</strong> by Ma<strong>in</strong> Activity of Head of Household, 2000/01<br />
<strong>and</strong> 2007<br />
Distribution of Household Monthly Income by Source of Income, by<br />
<strong>Poverty</strong>/Wealth Qu<strong>in</strong>tile <strong>and</strong> Area of Residence, 2000/01 <strong>and</strong> 2007<br />
Percent of Households with Income from Non-farm<br />
Self-employment <strong>and</strong> Mean Monthly Income, by Wealth Qu<strong>in</strong>tile <strong>and</strong><br />
Residence 2000/01 <strong>and</strong> 2007 (Tshs at 2000/01 prices)<br />
List Of tabLes<br />
Table 48: Prices of Processed Products relative to Prices of Locally Produced Products 168<br />
113<br />
121<br />
124<br />
144<br />
145<br />
159<br />
160<br />
163<br />
163<br />
165<br />
166<br />
167<br />
167<br />
xi


