

Poverty and Human Development Report 2009 - UNDP in Tanzania
Poverty and Human Development Report 2009 - UNDP in Tanzania
Poverty and Human Development Report 2009 - UNDP in Tanzania

You also want an ePaper? Increase the reach of your titles
YUMPU automatically turns print PDFs into web optimized ePapers that Google loves.
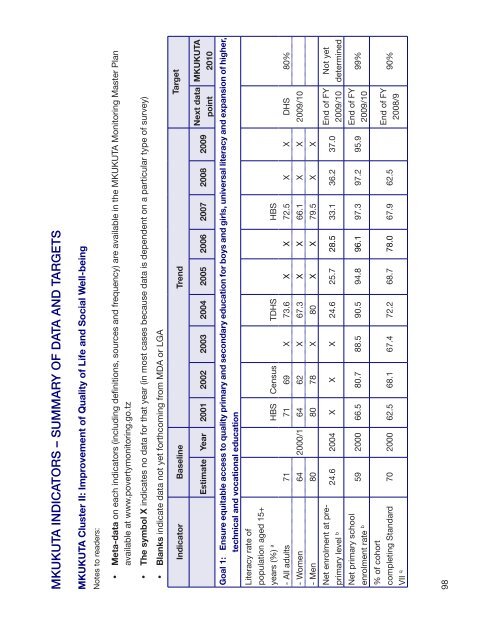
MKUKUTA INDICATORS – SUMMARY OF DATA AND TARGETS<br />
MKUKUTA Cluster II: Improvement of Quality of Life <strong>and</strong> Social Well-be<strong>in</strong>g<br />
Notes to readers:<br />
• Meta-data on each <strong>in</strong>dicators (<strong>in</strong>clud<strong>in</strong>g def<strong>in</strong>itions, sources <strong>and</strong> frequency) are available <strong>in</strong> the MKUKUTA Monitor<strong>in</strong>g Master Plan<br />
available at www.povertymonitor<strong>in</strong>g.go.tz<br />
• The symbol X <strong>in</strong>dicates no data for that year (<strong>in</strong> most cases because data is dependent on a particular type of survey)<br />
• Blanks <strong>in</strong>dicate data not yet forthcom<strong>in</strong>g from MDA or LGA<br />
Target<br />
Indicator Basel<strong>in</strong>e Trend<br />
Next data MKUKUTA<br />
Estimate Year 2001 2002 2003 2004 2005 2006 2007 2008 <strong>2009</strong><br />
po<strong>in</strong>t 2010<br />
Goal 1: Ensure equitable access to quality primary <strong>and</strong> secondary education for boys <strong>and</strong> girls, universal literacy <strong>and</strong> expansion of higher,<br />
technical <strong>and</strong> vocational education<br />
Literacy rate of<br />
population aged 15+<br />
years (%) a HBS Census TDHS HBS<br />
- All adults 71 71 69 X 73.6 X X 72.5 X X DHS 80%<br />
- Women 64 2000/1 64 62 X 67.3 X X 66.1 X X <strong>2009</strong>/10<br />
- Men 80 80 78 X 80 X X 79.5 X X<br />
Not yet<br />
determ<strong>in</strong>ed<br />
End of FY<br />
<strong>2009</strong>/10<br />
24.6 2004 X X X 24.6 25.7 28.5 33.1 36.2 37.0<br />
Net enrolment at preprimary<br />
level b<br />
99%<br />
End of FY<br />
<strong>2009</strong>/10<br />
59 2000 66.5 80.7 88.5 90.5 94.8 96.1 97.3 97.2 95.9<br />
Net primary school<br />
enrolment rate b<br />
90%<br />
End of FY<br />
2008/9<br />
70 2000 62.5 68.1 67.4 72.2 68.7 78.0 67.9 62.5<br />
% of cohort<br />
complet<strong>in</strong>g St<strong>and</strong>ard<br />
VII q<br />
98


