

Poverty and Human Development Report 2009 - UNDP in Tanzania
Poverty and Human Development Report 2009 - UNDP in Tanzania
Poverty and Human Development Report 2009 - UNDP in Tanzania

You also want an ePaper? Increase the reach of your titles
YUMPU automatically turns print PDFs into web optimized ePapers that Google loves.
pOVertY aND hUMaN DeVeLOpMeNt repOrt <strong>2009</strong><br />
With<strong>in</strong> agriculture there is little variation <strong>in</strong> poverty by type of crop grown. for <strong>in</strong>stance, amongst<br />
those whose ma<strong>in</strong> source of cash <strong>in</strong>come is the sale of food crops, 40% are poor, whereas 39%<br />
of those dependent on the sale of cash crops are poor. those dependent on the sale of livestock<br />
<strong>and</strong> livestock products have a lower rate of poverty (around 30%).<br />
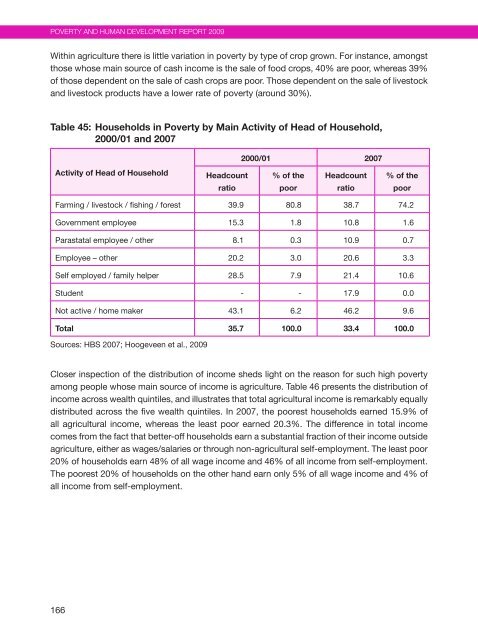
Table 45: Households <strong>in</strong> <strong>Poverty</strong> by Ma<strong>in</strong> Activity of Head of Household,<br />
2000/01 <strong>and</strong> 2007<br />
Activity of Head of Household<br />
166<br />
Headcount<br />
ratio<br />
2000/01 2007<br />
% of the<br />
poor<br />
Headcount<br />
ratio<br />
% of the<br />
farm<strong>in</strong>g / livestock / fish<strong>in</strong>g / forest 39.9 80.8 38.7 74.2<br />
Government employee 15.3 1.8 10.8 1.6<br />
parastatal employee / other 8.1 0.3 10.9 0.7<br />
employee – other 20.2 3.0 20.6 3.3<br />
self employed / family helper 28.5 7.9 21.4 10.6<br />
student - - 17.9 0.0<br />
not active / home maker 43.1 6.2 46.2 9.6<br />
Total 35.7 100.0 33.4 100.0<br />
sources: hBs 2007; hoogeveen et al., <strong>2009</strong><br />
Closer <strong>in</strong>spection of the distribution of <strong>in</strong>come sheds light on the reason for such high poverty<br />
among people whose ma<strong>in</strong> source of <strong>in</strong>come is agriculture. table 46 presents the distribution of<br />
<strong>in</strong>come across wealth qu<strong>in</strong>tiles, <strong>and</strong> illustrates that total agricultural <strong>in</strong>come is remarkably equally<br />
distributed across the five wealth qu<strong>in</strong>tiles. <strong>in</strong> 2007, the poorest households earned 15.9% of<br />
all agricultural <strong>in</strong>come, whereas the least poor earned 20.3%. the difference <strong>in</strong> total <strong>in</strong>come<br />
comes from the fact that better-off households earn a substantial fraction of their <strong>in</strong>come outside<br />
agriculture, either as wages/salaries or through non-agricultural self-employment. the least poor<br />
20% of households earn 48% of all wage <strong>in</strong>come <strong>and</strong> 46% of all <strong>in</strong>come from self-employment.<br />
the poorest 20% of households on the other h<strong>and</strong> earn only 5% of all wage <strong>in</strong>come <strong>and</strong> 4% of<br />
all <strong>in</strong>come from self-employment.<br />
poor


