

Poverty and Human Development Report 2009 - UNDP in Tanzania
Poverty and Human Development Report 2009 - UNDP in Tanzania
Poverty and Human Development Report 2009 - UNDP in Tanzania

You also want an ePaper? Increase the reach of your titles
YUMPU automatically turns print PDFs into web optimized ePapers that Google loves.
pOVertY aND hUMaN DeVeLOpMeNt repOrt <strong>2009</strong><br />
equipment, clothes, personal effects, personal care, recreation, clean<strong>in</strong>g, domestic services,<br />
contributions, fuel, petrol, soap <strong>and</strong> cigarettes, <strong>and</strong> other non-durable items (see table 35), as<br />
well as telecommunications, medical <strong>and</strong> education expenses. Assets (such as houses <strong>and</strong><br />
consumer durables) are not <strong>in</strong>cluded <strong>in</strong> consumption because these items provide ‘use value’<br />
for an extended period of time. 94<br />
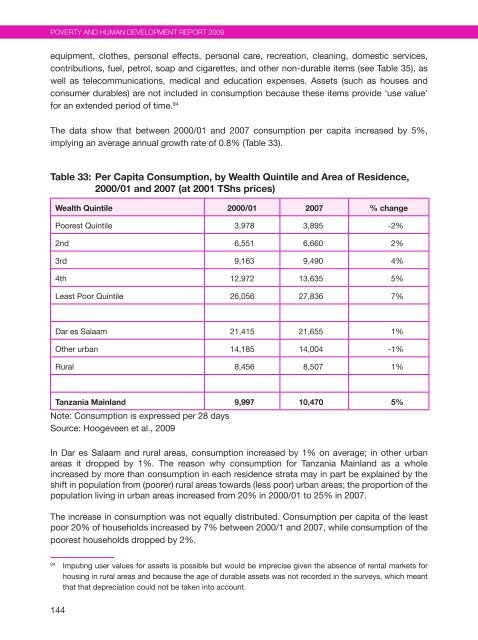
the data show that between 2000/01 <strong>and</strong> 2007 consumption per capita <strong>in</strong>creased by 5%,<br />
imply<strong>in</strong>g an average annual growth rate of 0.8% (table 33).<br />
Table 33: Per Capita Consumption, by Wealth Qu<strong>in</strong>tile <strong>and</strong> Area of Residence,<br />
2000/01 <strong>and</strong> 2007 (at 2001 TShs prices)<br />
Wealth Qu<strong>in</strong>tile 2000/01 2007 % change<br />
poorest Qu<strong>in</strong>tile 3,978 3,895 -2%<br />
2nd 6,551 6,660 2%<br />
3rd 9,163 9,490 4%<br />
4th 12,972 13,635 5%<br />
least poor Qu<strong>in</strong>tile 26,056 27,836 7%<br />
dar es salaam 21,415 21,655 1%<br />
other urban 14,185 14,004 -1%<br />
rural 8,456 8,507 1%<br />
<strong>Tanzania</strong> Ma<strong>in</strong>l<strong>and</strong> 9,997 10,470 5%<br />
note: Consumption is expressed per 28 days<br />
source: hoogeveen et al., <strong>2009</strong><br />
<strong>in</strong> dar es salaam <strong>and</strong> rural areas, consumption <strong>in</strong>creased by 1% on average; <strong>in</strong> other urban<br />
areas it dropped by 1%. the reason why consumption for tanzania Ma<strong>in</strong>l<strong>and</strong> as a whole<br />
<strong>in</strong>creased by more than consumption <strong>in</strong> each residence strata may <strong>in</strong> part be expla<strong>in</strong>ed by the<br />
shift <strong>in</strong> population from (poorer) rural areas towards (less poor) urban areas; the proportion of the<br />
population liv<strong>in</strong>g <strong>in</strong> urban areas <strong>in</strong>creased from 20% <strong>in</strong> 2000/01 to 25% <strong>in</strong> 2007.<br />
the <strong>in</strong>crease <strong>in</strong> consumption was not equally distributed. Consumption per capita of the least<br />
poor 20% of households <strong>in</strong>creased by 7% between 2000/1 <strong>and</strong> 2007, while consumption of the<br />
poorest households dropped by 2%.<br />
94 imput<strong>in</strong>g user values for assets is possible but would be imprecise given the absence of rental markets for<br />
hous<strong>in</strong>g <strong>in</strong> rural areas <strong>and</strong> because the age of durable assets was not recorded <strong>in</strong> the surveys, which meant<br />
that that depreciation could not be taken <strong>in</strong>to account.<br />
144


