

Poverty and Human Development Report 2009 - UNDP in Tanzania
Poverty and Human Development Report 2009 - UNDP in Tanzania
Poverty and Human Development Report 2009 - UNDP in Tanzania

You also want an ePaper? Increase the reach of your titles
YUMPU automatically turns print PDFs into web optimized ePapers that Google loves.
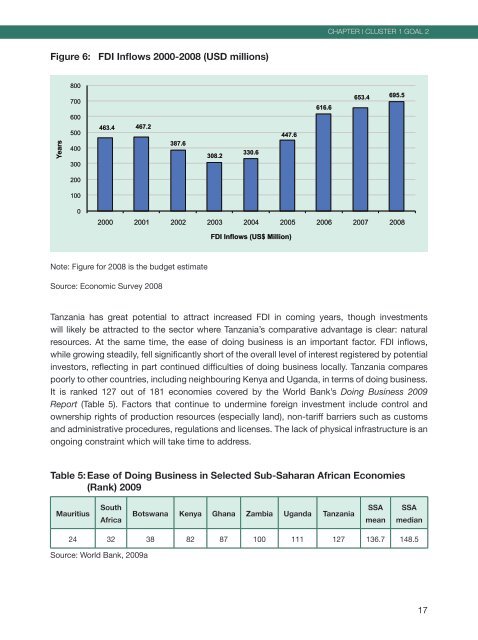
Figure 6: FDI Inflows 2000-2008 (USD millions)<br />
Years<br />
800<br />
700<br />
600<br />
500<br />
400<br />
300<br />
200<br />
100<br />
0<br />
463.4<br />
467.2<br />
387.6<br />
308.2<br />
330.6<br />
447.6<br />
616.6<br />
653.4<br />
695.5<br />
2000 2001 2002 2003 2004 2005 2006 2007 2008<br />
note: figure for 2008 is the budget estimate<br />
source: economic survey 2008<br />
FDI Inflows (US$ Million)<br />
tanzania has great potential to attract <strong>in</strong>creased fdi <strong>in</strong> com<strong>in</strong>g years, though <strong>in</strong>vestments<br />
will likely be attracted to the sector where tanzania’s comparative advantage is clear: natural<br />
resources. at the same time, the ease of do<strong>in</strong>g bus<strong>in</strong>ess is an important factor. fdi <strong>in</strong>flows,<br />
while grow<strong>in</strong>g steadily, fell significantly short of the overall level of <strong>in</strong>terest registered by potential<br />
<strong>in</strong>vestors, reflect<strong>in</strong>g <strong>in</strong> part cont<strong>in</strong>ued difficulties of do<strong>in</strong>g bus<strong>in</strong>ess locally. tanzania compares<br />
poorly to other countries, <strong>in</strong>clud<strong>in</strong>g neighbour<strong>in</strong>g Kenya <strong>and</strong> Ug<strong>and</strong>a, <strong>in</strong> terms of do<strong>in</strong>g bus<strong>in</strong>ess.<br />
it is ranked 127 out of 181 economies covered by the world bank’s Do<strong>in</strong>g Bus<strong>in</strong>ess <strong>2009</strong><br />
<strong>Report</strong> (table 5). factors that cont<strong>in</strong>ue to underm<strong>in</strong>e foreign <strong>in</strong>vestment <strong>in</strong>clude control <strong>and</strong><br />
ownership rights of production resources (especially l<strong>and</strong>), non-tariff barriers such as customs<br />
<strong>and</strong> adm<strong>in</strong>istrative procedures, regulations <strong>and</strong> licenses. the lack of physical <strong>in</strong>frastructure is an<br />
ongo<strong>in</strong>g constra<strong>in</strong>t which will take time to address.<br />
Table 5: Ease of Do<strong>in</strong>g Bus<strong>in</strong>ess <strong>in</strong> Selected Sub-Saharan African Economies<br />
(Rank) <strong>2009</strong><br />
Mauritius<br />
South<br />
Africa<br />
Botswana Kenya Ghana Zambia Ug<strong>and</strong>a <strong>Tanzania</strong><br />
SSA<br />
mean<br />
SSA<br />
median<br />
24 32 38 82 87 100 111 127 136.7 148.5<br />
source: world bank, <strong>2009</strong>a<br />
Chapter I CLUSter 1 GOaL 2<br />
17


