

Poverty and Human Development Report 2009 - UNDP in Tanzania
Poverty and Human Development Report 2009 - UNDP in Tanzania
Poverty and Human Development Report 2009 - UNDP in Tanzania

Create successful ePaper yourself
Turn your PDF publications into a flip-book with our unique Google optimized e-Paper software.
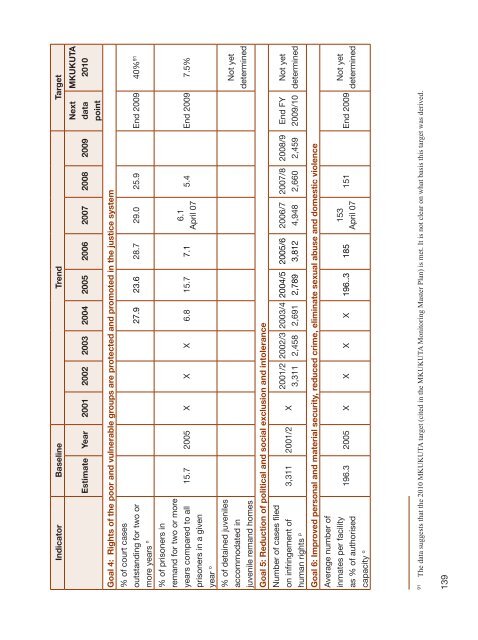
Indicator Basel<strong>in</strong>e Trend Target<br />
MKUKUTA<br />
2010<br />
Next<br />
data<br />
po<strong>in</strong>t<br />
Estimate Year 2001 2002 2003 2004 2005 2006 2007 2008 <strong>2009</strong><br />
Goal 4: Rights of the poor <strong>and</strong> vulnerable groups are protected <strong>and</strong> promoted <strong>in</strong> the justice system<br />
27.9 23.6 28.7 29.0 25.9 End <strong>2009</strong> 40% 91<br />
% of court cases<br />
outst<strong>and</strong><strong>in</strong>g for two or<br />
more years n<br />
5.4 End <strong>2009</strong> 7.5%<br />
6.1<br />
April 07<br />
15.7 2005 X X X 6.8 15.7 7.1<br />
% of prisoners <strong>in</strong><br />
rem<strong>and</strong> for two or more<br />
years compared to all<br />
prisoners <strong>in</strong> a given<br />
year o<br />
Not yet<br />
determ<strong>in</strong>ed<br />
% of deta<strong>in</strong>ed juveniles<br />
accommodated <strong>in</strong><br />
juvenile rem<strong>and</strong> homes<br />
Goal 5: Reduction of political <strong>and</strong> social exclusion <strong>and</strong> <strong>in</strong>tolerance<br />
Not yet<br />
determ<strong>in</strong>ed<br />
End FY<br />
<strong>2009</strong>/10<br />
2008/9<br />
2,459<br />
2007/8<br />
2,660<br />
2006/7<br />
4,948<br />
2005/6<br />
3,812<br />
2004/5<br />
2,789<br />
2003/4<br />
2,691<br />
2002/3<br />
2,458<br />
2001/2<br />
3,311<br />
3,311 2001/2 X<br />
Number of cases filed<br />
on <strong>in</strong>fr<strong>in</strong>gement of<br />
human rights p<br />
Goal 6: Improved personal <strong>and</strong> material security, reduced crime, elim<strong>in</strong>ate sexual abuse <strong>and</strong> domestic violence<br />
Not yet<br />
determ<strong>in</strong>ed<br />
151 End <strong>2009</strong><br />
153<br />
April 07<br />
196.3 2005 X X X X 196..3 185<br />
Average number of<br />
<strong>in</strong>mates per facility<br />
as % of authorised<br />
capacity o<br />
91 The data suggests that the 2010 MKUKUTA target (cited <strong>in</strong> the MKUKUTA Monitor<strong>in</strong>g Master Plan) is met. It is not clear on what basis this target was derived.<br />
139


