

Poverty and Human Development Report 2009 - UNDP in Tanzania
Poverty and Human Development Report 2009 - UNDP in Tanzania
Poverty and Human Development Report 2009 - UNDP in Tanzania

Create successful ePaper yourself
Turn your PDF publications into a flip-book with our unique Google optimized e-Paper software.
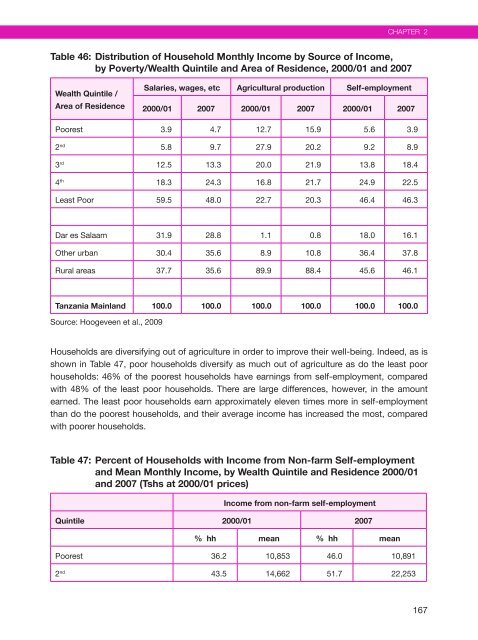
Table 46: Distribution of Household Monthly Income by Source of Income,<br />
by <strong>Poverty</strong>/Wealth Qu<strong>in</strong>tile <strong>and</strong> Area of Residence, 2000/01 <strong>and</strong> 2007<br />
Wealth Qu<strong>in</strong>tile /<br />
Area of Residence<br />
Salaries, wages, etc Agricultural production Self-employment<br />
2000/01 2007 2000/01 2007 2000/01 2007<br />
poorest 3.9 4.7 12.7 15.9 5.6 3.9<br />
2 nd 5.8 9.7 27.9 20.2 9.2 8.9<br />
3 rd 12.5 13.3 20.0 21.9 13.8 18.4<br />
4 th 18.3 24.3 16.8 21.7 24.9 22.5<br />
least poor 59.5 48.0 22.7 20.3 46.4 46.3<br />
dar es salaam 31.9 28.8 1.1 0.8 18.0 16.1<br />
other urban 30.4 35.6 8.9 10.8 36.4 37.8<br />
rural areas 37.7 35.6 89.9 88.4 45.6 46.1<br />
<strong>Tanzania</strong> Ma<strong>in</strong>l<strong>and</strong> 100.0 100.0 100.0 100.0 100.0 100.0<br />
source: hoogeveen et al., <strong>2009</strong><br />
households are diversify<strong>in</strong>g out of agriculture <strong>in</strong> order to improve their well-be<strong>in</strong>g. <strong>in</strong>deed, as is<br />
shown <strong>in</strong> table 47, poor households diversify as much out of agriculture as do the least poor<br />
households: 46% of the poorest households have earn<strong>in</strong>gs from self-employment, compared<br />
with 48% of the least poor households. there are large differences, however, <strong>in</strong> the amount<br />
earned. the least poor households earn approximately eleven times more <strong>in</strong> self-employment<br />
than do the poorest households, <strong>and</strong> their average <strong>in</strong>come has <strong>in</strong>creased the most, compared<br />
with poorer households.<br />
Table 47: Percent of Households with Income from Non-farm Self-employment<br />
<strong>and</strong> Mean Monthly Income, by Wealth Qu<strong>in</strong>tile <strong>and</strong> Residence 2000/01<br />
<strong>and</strong> 2007 (Tshs at 2000/01 prices)<br />
Income from non-farm self-employment<br />
Qu<strong>in</strong>tile 2000/01 2007<br />
% hh mean % hh mean<br />
Chapter 2<br />
poorest 36.2 10,853 46.0 10,891<br />
2 nd 43.5 14,662 51.7 22,253<br />
167


