

Poverty and Human Development Report 2009 - UNDP in Tanzania
Poverty and Human Development Report 2009 - UNDP in Tanzania
Poverty and Human Development Report 2009 - UNDP in Tanzania

Create successful ePaper yourself
Turn your PDF publications into a flip-book with our unique Google optimized e-Paper software.
POVERTY AND HUMAN DEVELOPMENT REPORT <strong>2009</strong><br />
As reported <strong>in</strong> Cluster I, levels of <strong>in</strong>come poverty decl<strong>in</strong>ed only slightly between the 2000/01 <strong>and</strong><br />
2007. Therefore, it is unlikely that recent improvements <strong>in</strong> nutrition among under fives, especially<br />
<strong>in</strong> rural areas, can be attributed to changes <strong>in</strong> <strong>in</strong>come/consumption. It is more probable that they<br />
reflect three ma<strong>in</strong> factors: (i) advances <strong>in</strong> malaria control described earlier; (ii) the <strong>in</strong>troduction of<br />
universal vitam<strong>in</strong> A distribution for <strong>in</strong>fants s<strong>in</strong>ce 2002 37 ; <strong>and</strong> (iii) the <strong>in</strong>crease <strong>in</strong> the proportion of<br />
women who breastfed their <strong>in</strong>fants exclusively up to three months of age (up from 25% <strong>in</strong> 1999<br />
to 42% <strong>in</strong> 2004/05).<br />
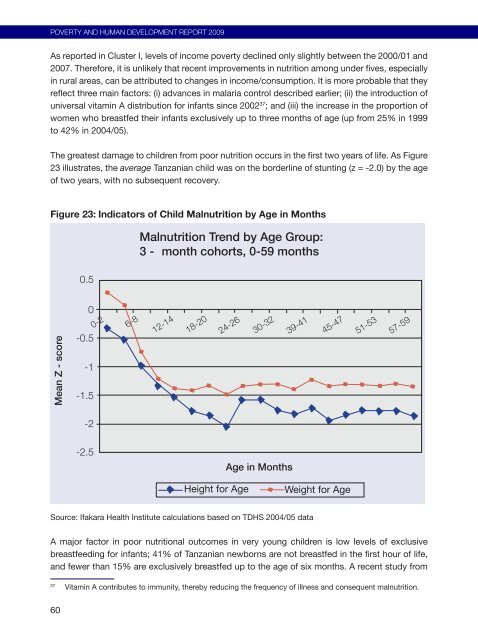
The greatest damage to children from poor nutrition occurs <strong>in</strong> the first two years of life. As Figure<br />
23 illustrates, the average <strong>Tanzania</strong>n child was on the borderl<strong>in</strong>e of stunt<strong>in</strong>g (z = -2.0) by the age<br />
of two years, with no subsequent recovery.<br />
Figure 23: Indicators of Child Malnutrition by Age <strong>in</strong> Months<br />
Mean Z - score<br />
60<br />
0.5<br />
0<br />
-0.5<br />
-1<br />
-1.5<br />
-2<br />
-2.5<br />
0-2<br />
6-8<br />
Malnutrition Trend by Age Group:<br />
3 - month cohorts, 0-59 months<br />
12-14<br />
18-20<br />
24-26<br />
30-32<br />
Age <strong>in</strong> Months<br />
39-41<br />
45-47<br />
Height for Age Weight for Age<br />
Source: Ifakara Health Institute calculations based on TDHS 2004/05 data<br />
51-53<br />
57-59<br />
A major factor <strong>in</strong> poor nutritional outcomes <strong>in</strong> very young children is low levels of exclusive<br />
breastfeed<strong>in</strong>g for <strong>in</strong>fants; 41% of <strong>Tanzania</strong>n newborns are not breastfed <strong>in</strong> the first hour of life,<br />
<strong>and</strong> fewer than 15% are exclusively breastfed up to the age of six months. A recent study from<br />
37 Vitam<strong>in</strong> A contributes to immunity, thereby reduc<strong>in</strong>g the frequency of illness <strong>and</strong> consequent malnutrition.


