

Poverty and Human Development Report 2009 - UNDP in Tanzania
Poverty and Human Development Report 2009 - UNDP in Tanzania
Poverty and Human Development Report 2009 - UNDP in Tanzania

Create successful ePaper yourself
Turn your PDF publications into a flip-book with our unique Google optimized e-Paper software.
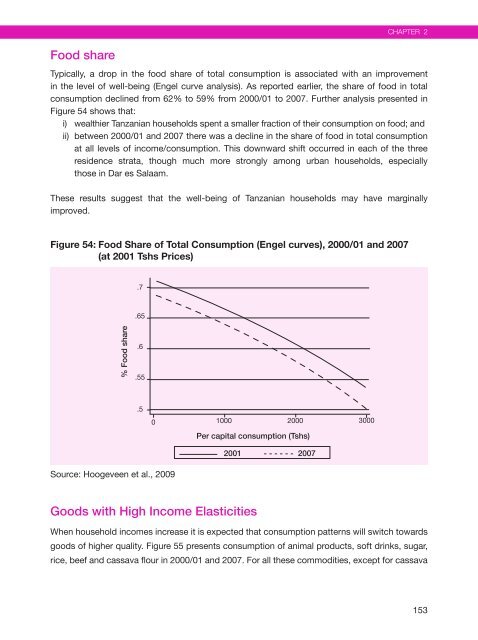
Food share<br />
typically, a drop <strong>in</strong> the food share of total consumption is associated with an improvement<br />
<strong>in</strong> the level of well-be<strong>in</strong>g (engel curve analysis). As reported earlier, the share of food <strong>in</strong> total<br />
consumption decl<strong>in</strong>ed from 62% to 59% from 2000/01 to 2007. further analysis presented <strong>in</strong><br />
figure 54 shows that:<br />
i) wealthier tanzanian households spent a smaller fraction of their consumption on food; <strong>and</strong><br />
ii) between 2000/01 <strong>and</strong> 2007 there was a decl<strong>in</strong>e <strong>in</strong> the share of food <strong>in</strong> total consumption<br />
at all levels of <strong>in</strong>come/consumption. this downward shift occurred <strong>in</strong> each of the three<br />
residence strata, though much more strongly among urban households, especially<br />
those <strong>in</strong> dar es salaam.<br />
these results suggest that the well-be<strong>in</strong>g of tanzanian households may have marg<strong>in</strong>ally<br />
improved.<br />
Figure 54: Food Share of Total Consumption (Engel curves), 2000/01 <strong>and</strong> 2007<br />
(at 2001 Tshs Prices)<br />
% Food share<br />
.65<br />
.55<br />
source: hoogeveen et al., <strong>2009</strong><br />
.7<br />
.6<br />
.5<br />
0 1000 2000 3000<br />
Per capital consumption (Tshs)<br />
Goods with High Income Elasticities<br />
2001 - - - - - - 2007<br />
Chapter 2<br />
When household <strong>in</strong>comes <strong>in</strong>crease it is expected that consumption patterns will switch towards<br />
goods of higher quality. figure 55 presents consumption of animal products, soft dr<strong>in</strong>ks, sugar,<br />
rice, beef <strong>and</strong> cassava flour <strong>in</strong> 2000/01 <strong>and</strong> 2007. for all these commodities, except for cassava<br />
153


