

Poverty and Human Development Report 2009 - UNDP in Tanzania
Poverty and Human Development Report 2009 - UNDP in Tanzania
Poverty and Human Development Report 2009 - UNDP in Tanzania

Create successful ePaper yourself
Turn your PDF publications into a flip-book with our unique Google optimized e-Paper software.
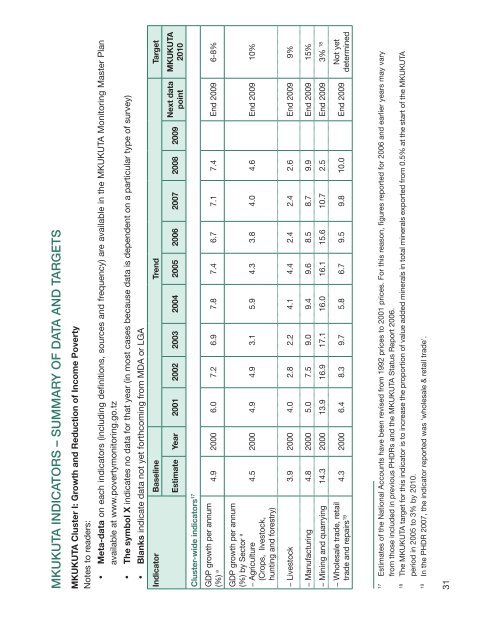
MKUKUTA INDICATORS – SUMMARY OF DATA AND TARGETS<br />
MKUKUTA Cluster I: Growth <strong>and</strong> Reduction of Income <strong>Poverty</strong><br />
notes to readers:<br />
• Meta-data on each <strong>in</strong>dicators (<strong>in</strong>clud<strong>in</strong>g def<strong>in</strong>itions, sources <strong>and</strong> frequency) are available <strong>in</strong> the MKUKUta Monitor<strong>in</strong>g Master Plan<br />
available at www.povertymonitor<strong>in</strong>g.go.tz<br />
• The symbol X <strong>in</strong>dicates no data for that year (<strong>in</strong> most cases because data is dependent on a particular type of survey)<br />
• Blanks <strong>in</strong>dicate data not yet forthcom<strong>in</strong>g from Mda or lga<br />
Indicator Basel<strong>in</strong>e Trend Target<br />
MKUKUTA<br />
2010<br />
Next data<br />
po<strong>in</strong>t<br />
Estimate Year 2001 2002 2003 2004 2005 2006 2007 2008 <strong>2009</strong><br />
Cluster-wide <strong>in</strong>dicators 17<br />
gdP growth per annum<br />
(%) a 4.9 2000 6.0 7.2 6.9 7.8 7.4 6.7 7.1 7.4 end <strong>2009</strong> 6-8%<br />
4.5 2000 4.9 4.9 3.1 5.9 4.3 3.8 4.0 4.6 end <strong>2009</strong> 10%<br />
gdP growth per annum<br />
(%) by sector a<br />
- agriculture<br />
(crops, livestock,<br />
hunt<strong>in</strong>g <strong>and</strong> forestry)<br />
- livestock 3.9 2000 4.0 2.8 2.2 4.1 4.4 2.4 2.4 2.6 end <strong>2009</strong> 9%<br />
- Manufactur<strong>in</strong>g 4.8 2000 5.0 7.5 9.0 9.4 9.6 8.5 8.7 9.9 end <strong>2009</strong> 15%<br />
- M<strong>in</strong><strong>in</strong>g <strong>and</strong> quarry<strong>in</strong>g 14.3 2000 13.9 16.9 17.1 16.0 16.1 15.6 10.7 2.5 end <strong>2009</strong> 3% 18<br />
not yet<br />
determ<strong>in</strong>ed<br />
- wholesale trade, retail<br />
trade <strong>and</strong> repairs19 4.3 2000 6.4 8.3 9.7 5.8 6.7 9.5 9.8 10.0 end <strong>2009</strong><br />
17 estimates of the national accounts have been revised from 1992 prices to 2001 prices. for this reason, figures reported for 2006 <strong>and</strong> earlier years may vary<br />
from those <strong>in</strong>cluded <strong>in</strong> previous Phdrs <strong>and</strong> the MKUKUta status report 2006.<br />
18 the MKUKUta target for this <strong>in</strong>dicator is to <strong>in</strong>crease the proportion of value added m<strong>in</strong>erals <strong>in</strong> total m<strong>in</strong>erals exported from 0.5% at the start of the MKUKUta<br />
period <strong>in</strong> 2005 to 3% by 2010.<br />
19 <strong>in</strong> the Phdr 2007, the <strong>in</strong>dicator reported was 'wholesale & retail trade'.<br />
31


