Poverty and Human Development Report 2009 - UNDP in Tanzania
Poverty and Human Development Report 2009 - UNDP in Tanzania
Poverty and Human Development Report 2009 - UNDP in Tanzania
You also want an ePaper? Increase the reach of your titles
YUMPU automatically turns print PDFs into web optimized ePapers that Google loves.
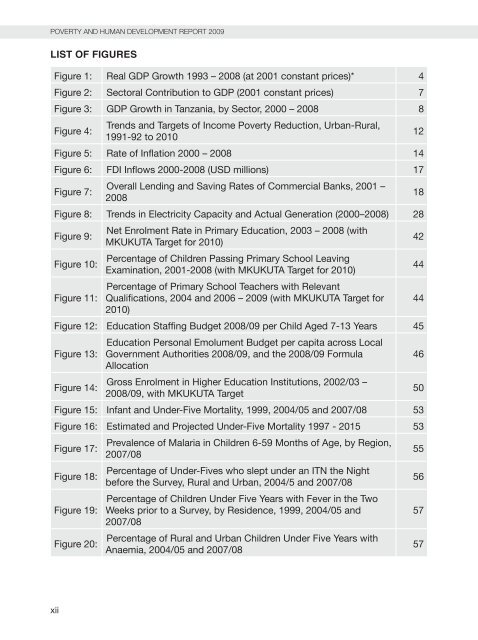
pOVertY aND hUMaN DeVeLOpMeNt repOrt <strong>2009</strong><br />
LisT Of figUREs<br />
Figure 1: Real GDP Growth 1993 – 2008 (at 2001 constant prices)* 4<br />
Figure 2: Sectoral Contribution to GDP (2001 constant prices) 7<br />
Figure 3: GDP Growth <strong>in</strong> <strong>Tanzania</strong>, by Sector, 2000 – 2008 8<br />
Figure 4:<br />
xii<br />
Trends <strong>and</strong> Targets of Income <strong>Poverty</strong> Reduction, Urban-Rural,<br />
1991-92 to 2010<br />
Figure 5: Rate of Inflation 2000 – 2008 14<br />
Figure 6: FDI Inflows 2000-2008 (USD millions) 17<br />
Figure 7:<br />
Overall Lend<strong>in</strong>g <strong>and</strong> Sav<strong>in</strong>g Rates of Commercial Banks, 2001 –<br />
2008<br />
Figure 8: Trends <strong>in</strong> Electricity Capacity <strong>and</strong> Actual Generation (2000–2008) 28<br />
Figure 9:<br />
Figure 10:<br />
Figure 11:<br />
Net Enrolment Rate <strong>in</strong> Primary Education, 2003 – 2008 (with<br />
MKUKUTA Target for 2010)<br />
Percentage of Children Pass<strong>in</strong>g Primary School Leav<strong>in</strong>g<br />
Exam<strong>in</strong>ation, 2001-2008 (with MKUKUTA Target for 2010)<br />
Percentage of Primary School Teachers with Relevant<br />
Qualifications, 2004 <strong>and</strong> 2006 – <strong>2009</strong> (with MKUKUTA Target for<br />
2010)<br />
Figure 12: Education Staff<strong>in</strong>g Budget 2008/09 per Child Aged 7-13 Years 45<br />
Figure 13:<br />
Figure 14:<br />
Education Personal Emolument Budget per capita across Local<br />
Government Authorities 2008/09, <strong>and</strong> the 2008/09 Formula<br />
Allocation<br />
Gross Enrolment <strong>in</strong> Higher Education Institutions, 2002/03 –<br />
2008/09, with MKUKUTA Target<br />
Figure 15: Infant <strong>and</strong> Under-Five Mortality, 1999, 2004/05 <strong>and</strong> 2007/08 53<br />
Figure 16: Estimated <strong>and</strong> Projected Under-Five Mortality 1997 - 2015 53<br />
Figure 17:<br />
Figure 18:<br />
Figure 19:<br />
Figure 20:<br />
Prevalence of Malaria <strong>in</strong> Children 6-59 Months of Age, by Region,<br />
2007/08<br />
Percentage of Under-Fives who slept under an ITN the Night<br />
before the Survey, Rural <strong>and</strong> Urban, 2004/5 <strong>and</strong> 2007/08<br />
Percentage of Children Under Five Years with Fever <strong>in</strong> the Two<br />
Weeks prior to a Survey, by Residence, 1999, 2004/05 <strong>and</strong><br />
2007/08<br />
Percentage of Rural <strong>and</strong> Urban Children Under Five Years with<br />
Anaemia, 2004/05 <strong>and</strong> 2007/08<br />
12<br />
18<br />
42<br />
44<br />
44<br />
46<br />
50<br />
55<br />
56<br />
57<br />
57


