

Poverty and Human Development Report 2009 - UNDP in Tanzania
Poverty and Human Development Report 2009 - UNDP in Tanzania
Poverty and Human Development Report 2009 - UNDP in Tanzania

Create successful ePaper yourself
Turn your PDF publications into a flip-book with our unique Google optimized e-Paper software.
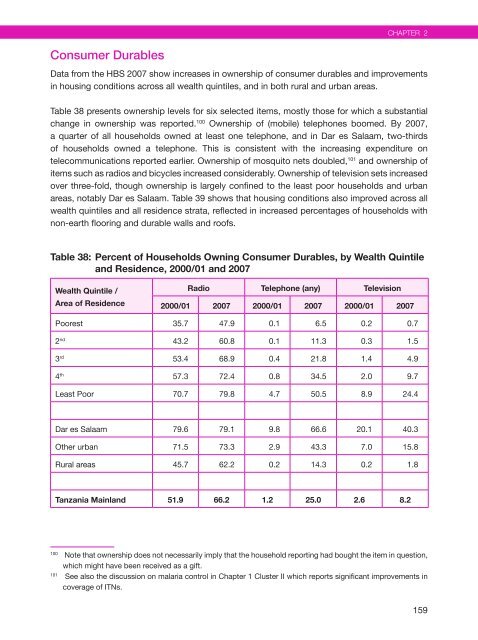
Consumer Durables<br />
data from the hBs 2007 show <strong>in</strong>creases <strong>in</strong> ownership of consumer durables <strong>and</strong> improvements<br />
<strong>in</strong> hous<strong>in</strong>g conditions across all wealth qu<strong>in</strong>tiles, <strong>and</strong> <strong>in</strong> both rural <strong>and</strong> urban areas.<br />
table 38 presents ownership levels for six selected items, mostly those for which a substantial<br />
change <strong>in</strong> ownership was reported. 100 ownership of (mobile) telephones boomed. By 2007,<br />
a quarter of all households owned at least one telephone, <strong>and</strong> <strong>in</strong> dar es salaam, two-thirds<br />
of households owned a telephone. this is consistent with the <strong>in</strong>creas<strong>in</strong>g expenditure on<br />
telecommunications reported earlier. ownership of mosquito nets doubled, 101 <strong>and</strong> ownership of<br />
items such as radios <strong>and</strong> bicycles <strong>in</strong>creased considerably. ownership of television sets <strong>in</strong>creased<br />
over three-fold, though ownership is largely conf<strong>in</strong>ed to the least poor households <strong>and</strong> urban<br />
areas, notably dar es salaam. table 39 shows that hous<strong>in</strong>g conditions also improved across all<br />
wealth qu<strong>in</strong>tiles <strong>and</strong> all residence strata, reflected <strong>in</strong> <strong>in</strong>creased percentages of households with<br />
non-earth floor<strong>in</strong>g <strong>and</strong> durable walls <strong>and</strong> roofs.<br />
Table 38: Percent of Households Own<strong>in</strong>g Consumer Durables, by Wealth Qu<strong>in</strong>tile<br />
<strong>and</strong> Residence, 2000/01 <strong>and</strong> 2007<br />
Wealth Qu<strong>in</strong>tile /<br />
Area of Residence<br />
Radio Telephone (any) Television<br />
2000/01 2007 2000/01 2007 2000/01 2007<br />
poorest 35.7 47.9 0.1 6.5 0.2 0.7<br />
2 nd 43.2 60.8 0.1 11.3 0.3 1.5<br />
3 rd 53.4 68.9 0.4 21.8 1.4 4.9<br />
4 th 57.3 72.4 0.8 34.5 2.0 9.7<br />
least poor 70.7 79.8 4.7 50.5 8.9 24.4<br />
dar es salaam 79.6 79.1 9.8 66.6 20.1 40.3<br />
other urban 71.5 73.3 2.9 43.3 7.0 15.8<br />
rural areas 45.7 62.2 0.2 14.3 0.2 1.8<br />
<strong>Tanzania</strong> Ma<strong>in</strong>l<strong>and</strong> 51.9 66.2 1.2 25.0 2.6 8.2<br />
100 note that ownership does not necessarily imply that the household report<strong>in</strong>g had bought the item <strong>in</strong> question,<br />
which might have been received as a gift.<br />
101 see also the discussion on malaria control <strong>in</strong> Chapter 1 Cluster ii which reports significant improvements <strong>in</strong><br />
coverage of itns.<br />
Chapter 2<br />
159


