- Page 1 and 2:
UNITED REPUBLIC OF TANZANIA POVERTY
- Page 3 and 4:
COnTEnTS List of Tables ...........
- Page 5 and 6:
MKUKUTA Cluster II: CONteNts Improv
- Page 7 and 8:
CONteNts Data.for.Monitoring.......
- Page 9 and 10:
CONteNts HOUSEHOLD OCCUPATION AND P
- Page 11 and 12:
Table 25: Table 26: Percent of Adul
- Page 13 and 14:
Figure 21: Figure 22: Percentage of
- Page 15 and 16:
LisT Of AbbREViATiONs AIDS Acquired
- Page 17:
PRSP Poverty Reduction Strategy Pap
- Page 21 and 22:
ExECUTIvE SUMMARy The Poverty and H
- Page 23 and 24:
in poverty. Nonetheless, the challe
- Page 25 and 26:
evise allocations based on identifi
- Page 27 and 28:
Monitoring Implications A comprehen
- Page 29:
eXeCUtiVe sUMMarY Good governance a
- Page 33 and 34:
Chapter Progress towards the goals
- Page 35 and 36:
GDP Growth by Sector the principal
- Page 37 and 38:
Figure 2: Sectoral Contribution to
- Page 39 and 40:
Chapter I CLUSter 1 Box 2: The Impa
- Page 41 and 42:
Household Income (Consumption) Pove
- Page 43 and 44:
Income Poverty and GDP Growth the 2
- Page 45 and 46:
although global oil and food prices
- Page 47 and 48:
Figure 6: FDI Inflows 2000-2008 (US
- Page 49 and 50:
orrow from outside tanzania, where
- Page 51 and 52:
Infrastructure Roads the condition
- Page 53 and 54:
quantity but also in quality. for i
- Page 55 and 56:
Chapter I CLUSter 1 GOaL 4 & 5 prop
- Page 57 and 58:
Customers Connected to Sources of E
- Page 59 and 60:
Cluster I Conclusions and Policy Im
- Page 61 and 62:
MKUKUTA INDICATORS - SUMMARY OF DAT
- Page 63 and 64:
Indicator Baseline Trend Target MKU
- Page 65 and 66:
Indicator Baseline Trend Target MKU
- Page 67 and 68:
Indicator Baseline Trend Target MKU
- Page 69 and 70:
MKUKUTA Cluster II: Improvement of
- Page 71 and 72:
Regional variations in enrolment ha
- Page 73 and 74:
CLUSTER II- GOAL 1 and/or not compl
- Page 75 and 76:
Pupil/Teacher Ratio Overall, the pu
- Page 77 and 78:
provision of housing, funding for w
- Page 79 and 80:
CLUSTER II- GOAL 1 Table 11: Primar
- Page 81 and 82:
Table 12: Benefit Incidence Analysi
- Page 83 and 84:
Figure 15: Infant and Under-Five Mo
- Page 85 and 86:
Figure 17: Prevalence of Malaria in
- Page 87 and 88:
Figure 19: Percentage of Children U
- Page 89 and 90:
Table 13: Indicators of Malnutritio
- Page 91 and 92:
CLUSTER II- GOAL 2 Ghana (Edmond et
- Page 93 and 94:
Figure 24: Percentage of Births Tak
- Page 95 and 96:
Figure 26: HIV Prevalence by Age Gr
- Page 97 and 98:
Figure 28: Projected Number of Adul
- Page 99 and 100:
Projections based on the model indi
- Page 101 and 102:
Access to Healthcare Services On th
- Page 103 and 104:
Health Services Development Strateg
- Page 105 and 106:
Figure 34: Access to Clean and Safe
- Page 110 and 111:
POVERTY AND HUMAN DEVELOPMENT REPOR
- Page 112 and 113:
POVERTY AND HUMAN DEVELOPMENT REPOR
- Page 114 and 115:
POVERTY AND HUMAN DEVELOPMENT REPOR
- Page 116 and 117:
POVERTY AND HUMAN DEVELOPMENT REPOR
- Page 118 and 119:
POVERTY AND HUMAN DEVELOPMENT REPOR
- Page 120 and 121:
POVERTY AND HUMAN DEVELOPMENT REPOR
- Page 122 and 123:
POVERTY AND HUMAN DEVELOPMENT REPOR
- Page 124 and 125:
POVERTY AND HUMAN DEVELOPMENT REPOR
- Page 126 and 127:
POVERTY AND HUMAN DEVELOPMENT REPOR
- Page 128 and 129:
MKUKUTA INDICATORS - SUMMARY OF DAT
- Page 130 and 131: Target Indicator Baseline Trend MKU
- Page 132 and 133: Target Indicator Baseline Trend MKU
- Page 134 and 135: Target Indicator Baseline Trend MKU
- Page 136 and 137: Sources: a = various sources as ind
- Page 138 and 139: POVERTY AND HUMAN DEVELOPMENT REPOR
- Page 140 and 141: POVERTY AND HUMAN DEVELOPMENT REPOR
- Page 142 and 143: POVERTY AND HUMAN DEVELOPMENT REPOR
- Page 144 and 145: POVERTY AND HUMAN DEVELOPMENT REPOR
- Page 146 and 147: POVERTY AND HUMAN DEVELOPMENT REPOR
- Page 148 and 149: POVERTY AND HUMAN DEVELOPMENT REPOR
- Page 150 and 151: POVERTY AND HUMAN DEVELOPMENT REPOR
- Page 152 and 153: POVERTY AND HUMAN DEVELOPMENT REPOR
- Page 154 and 155: POVERTY AND HUMAN DEVELOPMENT REPOR
- Page 156 and 157: POVERTY AND HUMAN DEVELOPMENT REPOR
- Page 158 and 159: POVERTY AND HUMAN DEVELOPMENT REPOR
- Page 160 and 161: POVERTY AND HUMAN DEVELOPMENT REPOR
- Page 162 and 163: POVERTY AND HUMAN DEVELOPMENT REPOR
- Page 164 and 165: Indicator Baseline Trend Target MKU
- Page 166 and 167: Indicator Baseline Trend Target MKU
- Page 168 and 169: Indicator Baseline Trend Target MKU
- Page 170 and 171: Indicator Baseline Trend Target MKU
- Page 173 and 174: Chapter 2 An AnAlysis of household
- Page 175 and 176: Composition of Consumption Consumpt
- Page 177 and 178: the poverty line basket was valued
- Page 179: Figure 50: Daily Caloric Intake per
- Page 183 and 184: Food share typically, a drop in the
- Page 185 and 186: Liters per Adult Equivalent Kilogra
- Page 187 and 188: Kilograms per Adult Equivalent 6 5
- Page 189 and 190: Consumer Durables data from the hBs
- Page 191 and 192: Additional data from the tanzania h
- Page 193 and 194: Table 41: Percent of All Households
- Page 195 and 196: Table 44: Percent of Males and Fema
- Page 197 and 198: Table 46: Distribution of Household
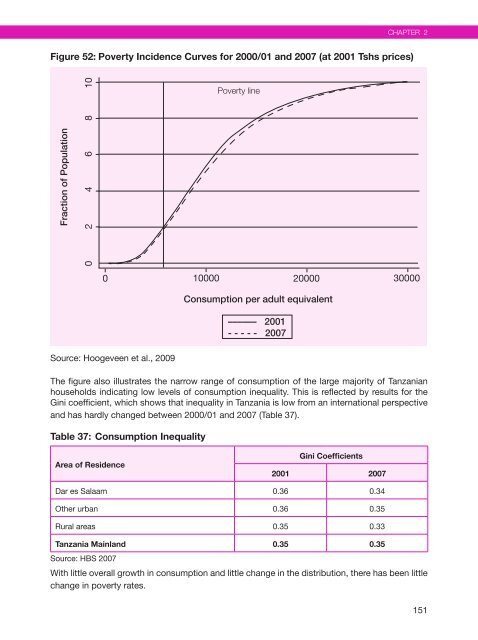
- Page 199: Conclusion Chapter 2 income poverty
- Page 202 and 203: pOVertY aND hUMaN DeVeLOpMeNt repOr
- Page 204 and 205: pOVertY aND hUMaN DeVeLOpMeNt repOr
- Page 206 and 207: pOVertY aND hUMaN DeVeLOpMeNt repOr
- Page 208 and 209: pOVertY aND hUMaN DeVeLOpMeNt repOr
- Page 210 and 211: pOVertY aND hUMaN DeVeLOpMeNt repOr
- Page 212 and 213: pOVertY aND hUMaN DeVeLOpMeNt repOr
- Page 214 and 215: pOVertY aND hUMaN DeVeLOpMeNt repOr
- Page 216 and 217: pOVertY aND hUMaN DeVeLOpMeNt repOr
- Page 218 and 219: pOVertY aND hUMaN DeVeLOpMeNt repOr
- Page 220: Chapter 2 Hoogeveen, J. & Ruhinduka


