

Poverty and Human Development Report 2009 - UNDP in Tanzania
Poverty and Human Development Report 2009 - UNDP in Tanzania
Poverty and Human Development Report 2009 - UNDP in Tanzania

You also want an ePaper? Increase the reach of your titles
YUMPU automatically turns print PDFs into web optimized ePapers that Google loves.
Income <strong>Poverty</strong> <strong>and</strong> GDP Growth<br />
the 2007 poverty estimates <strong>in</strong>dicate that the economy’s significant growth s<strong>in</strong>ce 2000/01 has<br />
not translated <strong>in</strong>to <strong>in</strong>come poverty reduction. 4 one possible explanation is that ris<strong>in</strong>g <strong>in</strong>equality<br />
has offset the ga<strong>in</strong>s from growth. however, this cannot be the case, s<strong>in</strong>ce <strong>in</strong>come <strong>in</strong>equality has<br />
hardly changed. it is important therefore to reflect on factors other than <strong>in</strong>come <strong>in</strong>equality that<br />
can expla<strong>in</strong> the apparent lack of impact of economic growth on <strong>in</strong>come poverty.<br />
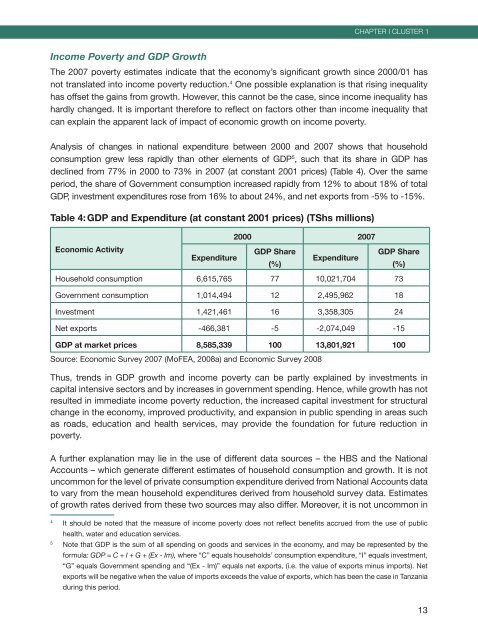
analysis of changes <strong>in</strong> national expenditure between 2000 <strong>and</strong> 2007 shows that household<br />
consumption grew less rapidly than other elements of gdP 5 , such that its share <strong>in</strong> gdP has<br />
decl<strong>in</strong>ed from 77% <strong>in</strong> 2000 to 73% <strong>in</strong> 2007 (at constant 2001 prices) (table 4). over the same<br />
period, the share of government consumption <strong>in</strong>creased rapidly from 12% to about 18% of total<br />
gdP, <strong>in</strong>vestment expenditures rose from 16% to about 24%, <strong>and</strong> net exports from -5% to -15%.<br />
Table 4: GDP <strong>and</strong> Expenditure (at constant 2001 prices) (TShs millions)<br />
Economic Activity<br />
Expenditure<br />
2000 2007<br />
GDP Share<br />
(%)<br />
Expenditure<br />
GDP Share<br />
household consumption 6,615,765 77 10,021,704 73<br />
government consumption 1,014,494 12 2,495,962 18<br />
<strong>in</strong>vestment 1,421,461 16 3,358,305 24<br />
net exports -466,381 -5 -2,074,049 -15<br />
GDP at market prices 8,585,339 100 13,801,921 100<br />
source: economic survey 2007 (Mofea, 2008a) <strong>and</strong> economic survey 2008<br />
Chapter I CLUSter 1<br />
thus, trends <strong>in</strong> gdP growth <strong>and</strong> <strong>in</strong>come poverty can be partly expla<strong>in</strong>ed by <strong>in</strong>vestments <strong>in</strong><br />
capital <strong>in</strong>tensive sectors <strong>and</strong> by <strong>in</strong>creases <strong>in</strong> government spend<strong>in</strong>g. hence, while growth has not<br />
resulted <strong>in</strong> immediate <strong>in</strong>come poverty reduction, the <strong>in</strong>creased capital <strong>in</strong>vestment for structural<br />
change <strong>in</strong> the economy, improved productivity, <strong>and</strong> expansion <strong>in</strong> public spend<strong>in</strong>g <strong>in</strong> areas such<br />
as roads, education <strong>and</strong> health services, may provide the foundation for future reduction <strong>in</strong><br />
poverty.<br />
a further explanation may lie <strong>in</strong> the use of different data sources – the hbs <strong>and</strong> the national<br />
accounts – which generate different estimates of household consumption <strong>and</strong> growth. it is not<br />
uncommon for the level of private consumption expenditure derived from national accounts data<br />
to vary from the mean household expenditures derived from household survey data. estimates<br />
of growth rates derived from these two sources may also differ. Moreover, it is not uncommon <strong>in</strong><br />
4 it should be noted that the measure of <strong>in</strong>come poverty does not reflect benefits accrued from the use of public<br />
health, water <strong>and</strong> education services.<br />
5 note that gdP is the sum of all spend<strong>in</strong>g on goods <strong>and</strong> services <strong>in</strong> the economy, <strong>and</strong> may be represented by the<br />
formula: GDP = C + I + G + (Ex - Im), where “c” equals households’ consumption expenditure, “i” equals <strong>in</strong>vestment,<br />
“g” equals government spend<strong>in</strong>g <strong>and</strong> “(ex - im)” equals net exports, (i.e. the value of exports m<strong>in</strong>us imports). net<br />
exports will be negative when the value of imports exceeds the value of exports, which has been the case <strong>in</strong> tanzania<br />
dur<strong>in</strong>g this period.<br />
(%)<br />
13


