

Poverty and Human Development Report 2009 - UNDP in Tanzania
Poverty and Human Development Report 2009 - UNDP in Tanzania
Poverty and Human Development Report 2009 - UNDP in Tanzania

You also want an ePaper? Increase the reach of your titles
YUMPU automatically turns print PDFs into web optimized ePapers that Google loves.
pOVertY aND hUMaN DeVeLOpMeNt repOrt <strong>2009</strong><br />
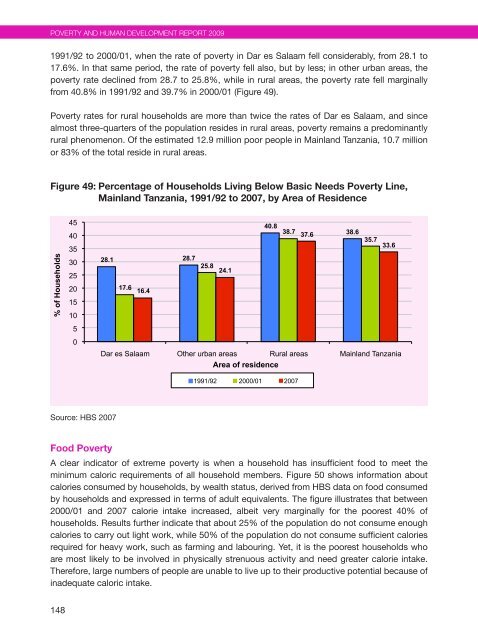
1991/92 to 2000/01, when the rate of poverty <strong>in</strong> dar es salaam fell considerably, from 28.1 to<br />
17.6%. <strong>in</strong> that same period, the rate of poverty fell also, but by less; <strong>in</strong> other urban areas, the<br />
poverty rate decl<strong>in</strong>ed from 28.7 to 25.8%, while <strong>in</strong> rural areas, the poverty rate fell marg<strong>in</strong>ally<br />
from 40.8% <strong>in</strong> 1991/92 <strong>and</strong> 39.7% <strong>in</strong> 2000/01 (figure 49).<br />
poverty rates for rural households are more than twice the rates of dar es salaam, <strong>and</strong> s<strong>in</strong>ce<br />
almost three-quarters of the population resides <strong>in</strong> rural areas, poverty rema<strong>in</strong>s a predom<strong>in</strong>antly<br />
rural phenomenon. of the estimated 12.9 million poor people <strong>in</strong> Ma<strong>in</strong>l<strong>and</strong> tanzania, 10.7 million<br />
or 83% of the total reside <strong>in</strong> rural areas.<br />
Figure 49: Percentage of Households Liv<strong>in</strong>g Below Basic Needs <strong>Poverty</strong> L<strong>in</strong>e,<br />
Ma<strong>in</strong>l<strong>and</strong> <strong>Tanzania</strong>, 1991/92 to 2007, by Area of Residence<br />
% of Households<br />
148<br />
45<br />
40<br />
35<br />
30<br />
25<br />
20<br />
15<br />
10<br />
5<br />
0<br />
28.1<br />
source: hBs 2007<br />
Food <strong>Poverty</strong><br />
17.6<br />
16.4<br />
28.7<br />
25.8<br />
24.1<br />
Dar es Salaam Other urban areas Rural areas Ma<strong>in</strong>l<strong>and</strong> <strong>Tanzania</strong><br />
Area of residence<br />
40.8<br />
38.7<br />
1991/92 2000/01 2007<br />
A clear <strong>in</strong>dicator of extreme poverty is when a household has <strong>in</strong>sufficient food to meet the<br />
m<strong>in</strong>imum caloric requirements of all household members. figure 50 shows <strong>in</strong>formation about<br />
calories consumed by households, by wealth status, derived from hBs data on food consumed<br />
by households <strong>and</strong> expressed <strong>in</strong> terms of adult equivalents. the figure illustrates that between<br />
2000/01 <strong>and</strong> 2007 calorie <strong>in</strong>take <strong>in</strong>creased, albeit very marg<strong>in</strong>ally for the poorest 40% of<br />
households. results further <strong>in</strong>dicate that about 25% of the population do not consume enough<br />
calories to carry out light work, while 50% of the population do not consume sufficient calories<br />
required for heavy work, such as farm<strong>in</strong>g <strong>and</strong> labour<strong>in</strong>g. yet, it is the poorest households who<br />
are most likely to be <strong>in</strong>volved <strong>in</strong> physically strenuous activity <strong>and</strong> need greater calorie <strong>in</strong>take.<br />
therefore, large numbers of people are unable to live up to their productive potential because of<br />
<strong>in</strong>adequate caloric <strong>in</strong>take.<br />
37.6<br />
38.6<br />
35.7<br />
33.6


