

Poverty and Human Development Report 2009 - UNDP in Tanzania
Poverty and Human Development Report 2009 - UNDP in Tanzania
Poverty and Human Development Report 2009 - UNDP in Tanzania

Create successful ePaper yourself
Turn your PDF publications into a flip-book with our unique Google optimized e-Paper software.
POVERTY AND HUMAN DEVELOPMENT REPORT <strong>2009</strong><br />
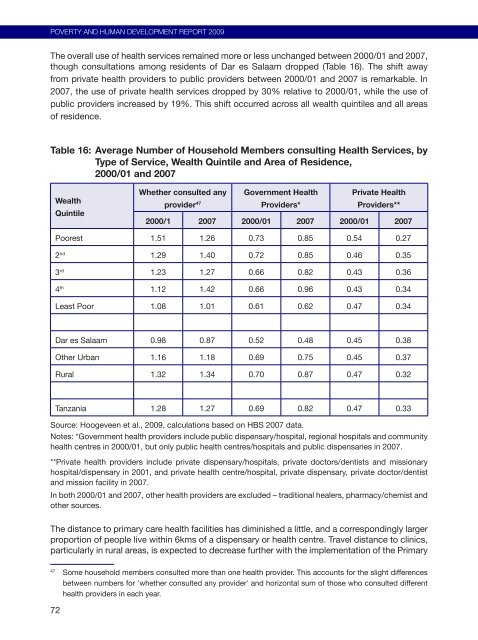
The overall use of health services rema<strong>in</strong>ed more or less unchanged between 2000/01 <strong>and</strong> 2007,<br />
though consultations among residents of Dar es Salaam dropped (Table 16). The shift away<br />
from private health providers to public providers between 2000/01 <strong>and</strong> 2007 is remarkable. In<br />
2007, the use of private health services dropped by 30% relative to 2000/01, while the use of<br />
public providers <strong>in</strong>creased by 19%. This shift occurred across all wealth qu<strong>in</strong>tiles <strong>and</strong> all areas<br />
of residence.<br />
Table 16: Average Number of Household Members consult<strong>in</strong>g Health Services, by<br />
Type of Service, Wealth Qu<strong>in</strong>tile <strong>and</strong> Area of Residence,<br />
2000/01 <strong>and</strong> 2007<br />
Wealth<br />
Qu<strong>in</strong>tile<br />
72<br />
Whether consulted any<br />
provider 47<br />
Government Health<br />
Providers*<br />
Private Health<br />
Providers**<br />
2000/1 2007 2000/01 2007 2000/01 2007<br />
Poorest 1.51 1.26 0.73 0.85 0.54 0.27<br />
2 nd 1.29 1.40 0.72 0.85 0.46 0.35<br />
3 rd 1.23 1.27 0.66 0.82 0.43 0.36<br />
4 th 1.12 1.42 0.66 0.96 0.43 0.34<br />
Least Poor 1.08 1.01 0.61 0.62 0.47 0.34<br />
Dar es Salaam 0.98 0.87 0.52 0.48 0.45 0.38<br />
Other Urban 1.16 1.18 0.69 0.75 0.45 0.37<br />
Rural 1.32 1.34 0.70 0.87 0.47 0.32<br />
<strong>Tanzania</strong> 1.28 1.27 0.69 0.82 0.47 0.33<br />
Source: Hoogeveen et al., <strong>2009</strong>, calculations based on HBS 2007 data.<br />
Notes: *Government health providers <strong>in</strong>clude public dispensary/hospital, regional hospitals <strong>and</strong> community<br />
health centres <strong>in</strong> 2000/01, but only public health centres/hospitals <strong>and</strong> public dispensaries <strong>in</strong> 2007.<br />
**Private health providers <strong>in</strong>clude private dispensary/hospitals, private doctors/dentists <strong>and</strong> missionary<br />
hospital/dispensary <strong>in</strong> 2001, <strong>and</strong> private health centre/hospital, private dispensary, private doctor/dentist<br />
<strong>and</strong> mission facility <strong>in</strong> 2007.<br />
In both 2000/01 <strong>and</strong> 2007, other health providers are excluded – traditional healers, pharmacy/chemist <strong>and</strong><br />
other sources. 47<br />
The distance to primary care health facilities has dim<strong>in</strong>ished a little, <strong>and</strong> a correspond<strong>in</strong>gly larger<br />
proportion of people live with<strong>in</strong> 6kms of a dispensary or health centre. Travel distance to cl<strong>in</strong>ics,<br />
particularly <strong>in</strong> rural areas, is expected to decrease further with the implementation of the Primary<br />
47 Some household members consulted more than one health provider. This accounts for the slight differences<br />
between numbers for 'whether consulted any provider' <strong>and</strong> horizontal sum of those who consulted different<br />
health providers <strong>in</strong> each year.


