

Poverty and Human Development Report 2009 - UNDP in Tanzania
Poverty and Human Development Report 2009 - UNDP in Tanzania
Poverty and Human Development Report 2009 - UNDP in Tanzania

Create successful ePaper yourself
Turn your PDF publications into a flip-book with our unique Google optimized e-Paper software.
CLUSTER II- GOAL 1<br />
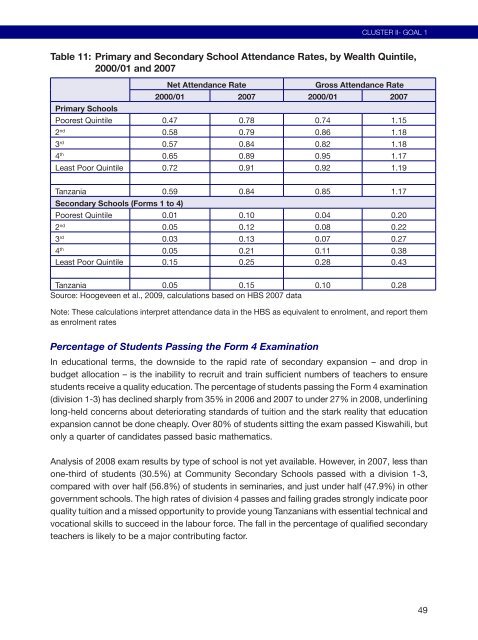
Table 11: Primary <strong>and</strong> Secondary School Attendance Rates, by Wealth Qu<strong>in</strong>tile,<br />
2000/01 <strong>and</strong> 2007<br />
Net Attendance Rate Gross Attendance Rate<br />
2000/01 2007 2000/01 2007<br />
Primary Schools<br />
Poorest Qu<strong>in</strong>tile 0.47 0.78 0.74 1.15<br />
2nd 0.58 0.79 0.86 1.18<br />
3rd 0.57 0.84 0.82 1.18<br />
4th 0.65 0.89 0.95 1.17<br />
Least Poor Qu<strong>in</strong>tile 0.72 0.91 0.92 1.19<br />
<strong>Tanzania</strong> 0.59 0.84 0.85 1.17<br />
Secondary Schools (Forms 1 to 4)<br />
Poorest Qu<strong>in</strong>tile 0.01 0.10 0.04 0.20<br />
2nd 0.05 0.12 0.08 0.22<br />
3rd 0.03 0.13 0.07 0.27<br />
4th 0.05 0.21 0.11 0.38<br />
Least Poor Qu<strong>in</strong>tile 0.15 0.25 0.28 0.43<br />
<strong>Tanzania</strong> 0.05 0.15 0.10 0.28<br />
Source: Hoogeveen et al., <strong>2009</strong>, calculations based on HBS 2007 data<br />
Note: These calculations <strong>in</strong>terpret attendance data <strong>in</strong> the HBS as equivalent to enrolment, <strong>and</strong> report them<br />
as enrolment rates<br />
Percentage of Students Pass<strong>in</strong>g the Form 4 Exam<strong>in</strong>ation<br />
In educational terms, the downside to the rapid rate of secondary expansion – <strong>and</strong> drop <strong>in</strong><br />
budget allocation – is the <strong>in</strong>ability to recruit <strong>and</strong> tra<strong>in</strong> sufficient numbers of teachers to ensure<br />
students receive a quality education. The percentage of students pass<strong>in</strong>g the Form 4 exam<strong>in</strong>ation<br />
(division 1-3) has decl<strong>in</strong>ed sharply from 35% <strong>in</strong> 2006 <strong>and</strong> 2007 to under 27% <strong>in</strong> 2008, underl<strong>in</strong><strong>in</strong>g<br />
long-held concerns about deteriorat<strong>in</strong>g st<strong>and</strong>ards of tuition <strong>and</strong> the stark reality that education<br />
expansion cannot be done cheaply. Over 80% of students sitt<strong>in</strong>g the exam passed Kiswahili, but<br />
only a quarter of c<strong>and</strong>idates passed basic mathematics.<br />
Analysis of 2008 exam results by type of school is not yet available. However, <strong>in</strong> 2007, less than<br />
one-third of students (30.5%) at Community Secondary Schools passed with a division 1-3,<br />
compared with over half (56.8%) of students <strong>in</strong> sem<strong>in</strong>aries, <strong>and</strong> just under half (47.9%) <strong>in</strong> other<br />
government schools. The high rates of division 4 passes <strong>and</strong> fail<strong>in</strong>g grades strongly <strong>in</strong>dicate poor<br />
quality tuition <strong>and</strong> a missed opportunity to provide young <strong>Tanzania</strong>ns with essential technical <strong>and</strong><br />
vocational skills to succeed <strong>in</strong> the labour force. The fall <strong>in</strong> the percentage of qualified secondary<br />
teachers is likely to be a major contribut<strong>in</strong>g factor.<br />
49


