

Poverty and Human Development Report 2009 - UNDP in Tanzania
Poverty and Human Development Report 2009 - UNDP in Tanzania
Poverty and Human Development Report 2009 - UNDP in Tanzania

You also want an ePaper? Increase the reach of your titles
YUMPU automatically turns print PDFs into web optimized ePapers that Google loves.
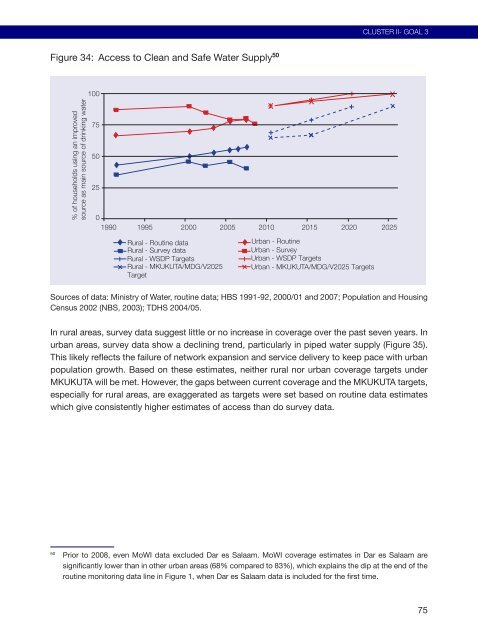
Figure 34: Access to Clean <strong>and</strong> Safe Water Supply 50<br />
% of households us<strong>in</strong>g an improved<br />
source as ma<strong>in</strong> source of dr<strong>in</strong>k<strong>in</strong>g water<br />
100<br />
75<br />
50<br />
25<br />
0<br />
1990<br />
1995 2000 2005 2010 2015 2020 2025<br />
Rural - Rout<strong>in</strong>e data<br />
Rural - Survey data<br />
Rural - WSDP Targets<br />
Rural - MKUKUTA/MDG/V2025<br />
Target<br />
Urban - Rout<strong>in</strong>e<br />
Urban - Survey<br />
Urban - WSDP Targets<br />
Urban - MKUKUTA/MDG/V2025 Targets<br />
CLUSTER II- GOAL 3<br />
Sources of data: M<strong>in</strong>istry of Water, rout<strong>in</strong>e data; HBS 1991-92, 2000/01 <strong>and</strong> 2007; Population <strong>and</strong> Hous<strong>in</strong>g<br />
Census 2002 (NBS, 2003); TDHS 2004/05.<br />
In rural areas, survey data suggest little or no <strong>in</strong>crease <strong>in</strong> coverage over the past seven years. In<br />
urban areas, survey data show a decl<strong>in</strong><strong>in</strong>g trend, particularly <strong>in</strong> piped water supply (Figure 35).<br />
This likely reflects the failure of network expansion <strong>and</strong> service delivery to keep pace with urban<br />
population growth. Based on these estimates, neither rural nor urban coverage targets under<br />
MKUKUTA will be met. However, the gaps between current coverage <strong>and</strong> the MKUKUTA targets,<br />
especially for rural areas, are exaggerated as targets were set based on rout<strong>in</strong>e data estimates<br />
which give consistently higher estimates of access than do survey data.<br />
50 Prior to 2008, even MoWI data excluded Dar es Salaam. MoWI coverage estimates <strong>in</strong> Dar es Salaam are<br />
significantly lower than <strong>in</strong> other urban areas (68% compared to 83%), which expla<strong>in</strong>s the dip at the end of the<br />
rout<strong>in</strong>e monitor<strong>in</strong>g data l<strong>in</strong>e <strong>in</strong> Figure 1, when Dar es Salaam data is <strong>in</strong>cluded for the first time.<br />
75


