

Poverty and Human Development Report 2009 - UNDP in Tanzania
Poverty and Human Development Report 2009 - UNDP in Tanzania
Poverty and Human Development Report 2009 - UNDP in Tanzania

Create successful ePaper yourself
Turn your PDF publications into a flip-book with our unique Google optimized e-Paper software.
pOVertY aND hUMaN DeVeLOpMeNt repOrt <strong>2009</strong><br />
168<br />
Income from non-farm self-employment<br />
Qu<strong>in</strong>tile 2000/01 2007<br />
3 rd 43.9 21,912 54.3 43,894<br />
4 th 49.7 34,896 53.9 54,221<br />
least poor 49.5 65,292 48.2 125,135<br />
dar es salaam 46.9 81,850 51.0 108,053<br />
other urban 55.4 59,891 46.6 98,063<br />
rural 42.3 19,178 52.1 32,305<br />
<strong>Tanzania</strong> Ma<strong>in</strong>l<strong>and</strong> 44.6 31,209 50.8 50,999<br />
source: hoogeveen et al., <strong>2009</strong><br />
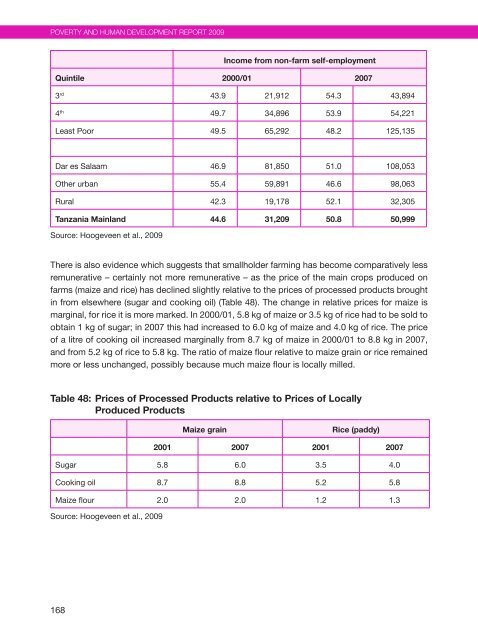
there is also evidence which suggests that smallholder farm<strong>in</strong>g has become comparatively less<br />
remunerative – certa<strong>in</strong>ly not more remunerative – as the price of the ma<strong>in</strong> crops produced on<br />
farms (maize <strong>and</strong> rice) has decl<strong>in</strong>ed slightly relative to the prices of processed products brought<br />
<strong>in</strong> from elsewhere (sugar <strong>and</strong> cook<strong>in</strong>g oil) (table 48). the change <strong>in</strong> relative prices for maize is<br />
marg<strong>in</strong>al, for rice it is more marked. <strong>in</strong> 2000/01, 5.8 kg of maize or 3.5 kg of rice had to be sold to<br />
obta<strong>in</strong> 1 kg of sugar; <strong>in</strong> 2007 this had <strong>in</strong>creased to 6.0 kg of maize <strong>and</strong> 4.0 kg of rice. the price<br />
of a litre of cook<strong>in</strong>g oil <strong>in</strong>creased marg<strong>in</strong>ally from 8.7 kg of maize <strong>in</strong> 2000/01 to 8.8 kg <strong>in</strong> 2007,<br />
<strong>and</strong> from 5.2 kg of rice to 5.8 kg. the ratio of maize flour relative to maize gra<strong>in</strong> or rice rema<strong>in</strong>ed<br />
more or less unchanged, possibly because much maize flour is locally milled.<br />
Table 48: Prices of Processed Products relative to Prices of Locally<br />
Produced Products<br />
Maize gra<strong>in</strong> Rice (paddy)<br />
2001 2007 2001 2007<br />
sugar 5.8 6.0 3.5 4.0<br />
Cook<strong>in</strong>g oil 8.7 8.8 5.2 5.8<br />
Maize flour 2.0 2.0 1.2 1.3<br />
source: hoogeveen et al., <strong>2009</strong>


