

Poverty and Human Development Report 2009 - UNDP in Tanzania
Poverty and Human Development Report 2009 - UNDP in Tanzania
Poverty and Human Development Report 2009 - UNDP in Tanzania

You also want an ePaper? Increase the reach of your titles
YUMPU automatically turns print PDFs into web optimized ePapers that Google loves.
pOVertY aND hUMaN DeVeLOpMeNt repOrt <strong>2009</strong><br />
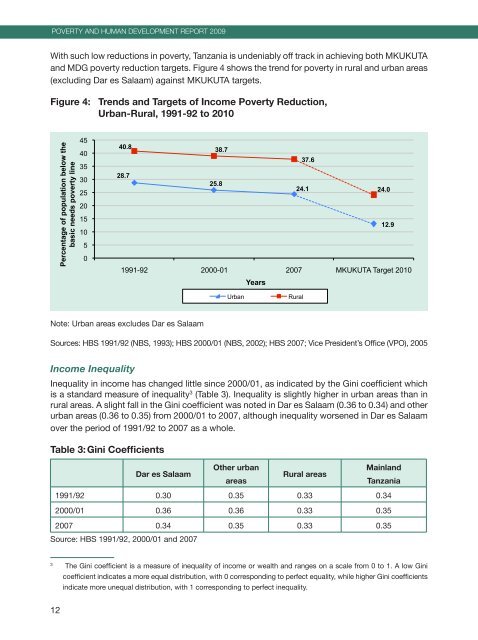
with such low reductions <strong>in</strong> poverty, tanzania is undeniably off track <strong>in</strong> achiev<strong>in</strong>g both MKUKUta<br />
<strong>and</strong> Mdg poverty reduction targets. figure 4 shows the trend for poverty <strong>in</strong> rural <strong>and</strong> urban areas<br />
(exclud<strong>in</strong>g dar es salaam) aga<strong>in</strong>st MKUKUta targets.<br />
Figure 4: Trends <strong>and</strong> Targets of Income <strong>Poverty</strong> Reduction,<br />
Urban-Rural, 1991-92 to 2010<br />
12<br />
Percentage of population below the<br />
basic needs poverty l<strong>in</strong>e<br />
45<br />
40<br />
35<br />
30<br />
25<br />
20<br />
15<br />
10<br />
5<br />
0<br />
40.8<br />
28.7<br />
38.7<br />
25.8<br />
1991-92 2000-01 2007 MKUKUTA Target 2010<br />
note: Urban areas excludes dar es salaam<br />
Years<br />
37.6<br />
24.1<br />
Urban Rural<br />
sources: hbs 1991/92 (nbs, 1993); hbs 2000/01 (nbs, 2002); hbs 2007; vice President’s office (vPo), 2005<br />
Income Inequality<br />
<strong>in</strong>equality <strong>in</strong> <strong>in</strong>come has changed little s<strong>in</strong>ce 2000/01, as <strong>in</strong>dicated by the g<strong>in</strong>i coefficient which<br />
is a st<strong>and</strong>ard measure of <strong>in</strong>equality3 (table 3). <strong>in</strong>equality is slightly higher <strong>in</strong> urban areas than <strong>in</strong><br />
rural areas. a slight fall <strong>in</strong> the g<strong>in</strong>i coefficient was noted <strong>in</strong> dar es salaam (0.36 to 0.34) <strong>and</strong> other<br />
urban areas (0.36 to 0.35) from 2000/01 to 2007, although <strong>in</strong>equality worsened <strong>in</strong> dar es salaam<br />
over the period of 1991/92 to 2007 as a whole.<br />
Table 3: G<strong>in</strong>i Coefficients<br />
Dar es Salaam<br />
Other urban<br />
areas<br />
Rural areas<br />
24.0<br />
12.9<br />
Ma<strong>in</strong>l<strong>and</strong><br />
<strong>Tanzania</strong><br />
1991/92 0.30 0.35 0.33 0.34<br />
2000/01 0.36 0.36 0.33 0.35<br />
2007 0.34 0.35 0.33 0.35<br />
source: hbs 1991/92, 2000/01 <strong>and</strong> 2007<br />
3 the g<strong>in</strong>i coefficient is a measure of <strong>in</strong>equality of <strong>in</strong>come or wealth <strong>and</strong> ranges on a scale from 0 to 1. a low g<strong>in</strong>i<br />
coefficient <strong>in</strong>dicates a more equal distribution, with 0 correspond<strong>in</strong>g to perfect equality, while higher g<strong>in</strong>i coefficients<br />
<strong>in</strong>dicate more unequal distribution, with 1 correspond<strong>in</strong>g to perfect <strong>in</strong>equality.


