- Page 1 and 2:
Northeast Subsistence-Settlement Ch
- Page 3 and 4:
Northeast Subsistence-Settlement Ch
- Page 5 and 6:
TABLE OF CONTENTS List of Figures L
- Page 7 and 8:
LIST OF FIGURES 2.1 Map of the cent
- Page 9 and 10:
9.3 Topographic map of Broome Tech.
- Page 11 and 12:
11.1 Upper Susquehanna Site Types (
- Page 13 and 14:
PREFACE The New York State Museum h
- Page 15 and 16:
CHAPTER 1 INTRODUCTION Christina B.
- Page 17 and 18:
domesticates and the occupation of
- Page 19 and 20:
and Rieth highlight the important c
- Page 21 and 22:
Dunnell, R. C. (1971). Systematics
- Page 23 and 24:
Anthropology, University of Massach
- Page 25 and 26:
CHAPTER 2 CENTRAL OHIO VALLEY DURIN
- Page 27 and 28:
L a k e E r i e PENNSYLVANIA INDIAN
- Page 29 and 30:
L a k e E r i e INDIANA R i v e r G
- Page 31 and 32:
Olentangy River and other minor tri
- Page 33 and 34:
Figure 2.6. Comparison of Late Wood
- Page 35 and 36:
support the notion of resource stre
- Page 37 and 38:
F4 F7 F5 F6 F3 F2 F9 F10 F12 F13 F1
- Page 39 and 40:
B B M F42 F43 F41 F44 S5 S4 S1 F30
- Page 41 and 42:
Table 2.3. continued Temporal Age A
- Page 43 and 44:
Table 2.3. continued Temporal Age A
- Page 45 and 46:
L a k e E r i e INDIANA o i O h Sal
- Page 47 and 48:
Figure 2.13. Map of the Late Prehis
- Page 49 and 50:
Figure 2.15. Map of households with
- Page 51 and 52:
Figure 2.17. Sample of Late Prehist
- Page 53 and 54:
Barkes, B. M. (1982). An Analysis o
- Page 55 and 56:
Fort Ancient Tradition, edited by J
- Page 57 and 58:
CHAPTER 3 “ . . . to reconstruct
- Page 59 and 60:
IT TAKES A VILLAGE Figure 3.2. Arti
- Page 61 and 62:
social organizations is drawn prima
- Page 63 and 64:
elements of the village, the spaces
- Page 65 and 66:
Diametric, concentric, and circumfe
- Page 67 and 68:
egion, including Reckner (Augustine
- Page 69 and 70:
Chapter 3 Modeling Village Communit
- Page 71 and 72:
Figure 3.9. Architectural and nonar
- Page 73 and 74:
Figure 3.11. Measuring distances in
- Page 75 and 76:
Table 3.2. Descriptive Statistics f
- Page 77 and 78:
DISCUSSION Table 3.3. Descriptive S
- Page 79 and 80:
Figure 3.14. Box-and-whisker plot o
- Page 81 and 82:
Augustine, E. A. (1938d). Important
- Page 83 and 84:
Among Some Amazon Tribes. Privately
- Page 85 and 86:
on Black Mesa, Arizona. The Univers
- Page 87 and 88:
CHAPTER 4 THE EARLY LATE WOODLAND I
- Page 89 and 90:
Figure 4.3. Gibraltar Cordmarked ce
- Page 91 and 92:
Figure 4.5. Ceramics of the Gibralt
- Page 93 and 94:
points and notched Chesser or Lowe
- Page 95 and 96:
dated to A.D. 890 (1025) 1230 (DIC-
- Page 97 and 98:
Table 4.3. Available Stable Carbon
- Page 99 and 100:
where fishing and farming may have
- Page 101 and 102:
Figure 4.10. Ceramic of the Sandusk
- Page 103 and 104:
singular Mixter Stamped vessels typ
- Page 105 and 106: urial with the dead, broadcasted a
- Page 107 and 108: during the early Late Woodland time
- Page 109 and 110: Valley. North American Archaeologis
- Page 111 and 112: CHAPTER 5 RECENT DEVELOPMENTS IN TH
- Page 113 and 114: interest in exchange of service or
- Page 115 and 116: CURRENT INVESTIGATIONS In view of t
- Page 117 and 118: 710 Area C 700 B-75084 TO-4556 TO-4
- Page 119 and 120: Table 5.1. Summary of Artifacts fro
- Page 121 and 122: e Bull's Point C o o t e s P a r a
- Page 123 and 124: classification system has been appl
- Page 125 and 126: (Crawford et al. 1997a). The same i
- Page 127 and 128: in Ontario was Middle Woodland-deri
- Page 129 and 130: 207-212. Smithsonian Institution, W
- Page 131 and 132: CHAPTER 6 EARLY LATE WOODLAND IN SO
- Page 133 and 134: Figure 6.2. Lower Grand River Valle
- Page 135 and 136: Table 6.1. Radiocarbon Dates from t
- Page 137 and 138: segment of the terrace that effecti
- Page 139 and 140: Figure 6.7. Meyer site terrace, vie
- Page 141 and 142: Figure 6.10. Forster site reconstru
- Page 143 and 144: Figure 6.12. Middle Thames River 20
- Page 145 and 146: Figure 6.13. Site situation: a comp
- Page 147 and 148: Dieterman, F. (2001). Princess Poin
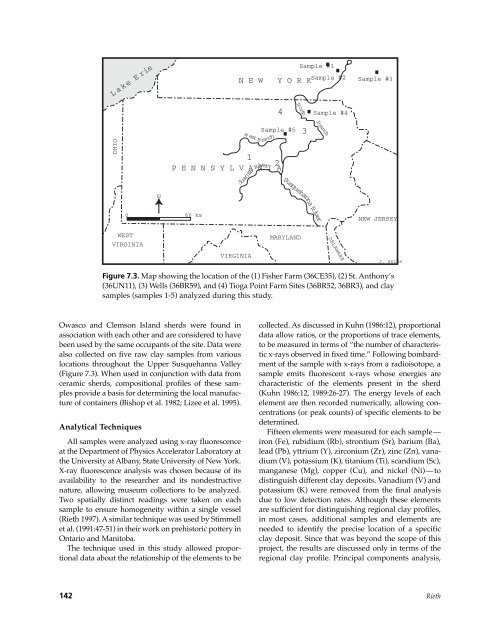
- Page 149 and 150: CHAPTER 7 EARLY LATE PREHISTORIC SE
- Page 151 and 152: ticultural hamlets, small and large
- Page 153 and 154: that Clemson Island was greatly inf
- Page 155: local deposits. Alternately, Stimme
- Page 159 and 160: Pennsylvania continued to practice
- Page 161 and 162: level) overlaps with the West Branc
- Page 163 and 164: Under a population metaphysic, the
- Page 165 and 166: Hatch, J. W., and Koontz, K. L. (19
- Page 167 and 168: CHAPTER 8 NEW DATES FOR OWASCO POTS
- Page 169 and 170: Table 8.1. Key Components of the Th
- Page 171 and 172: Figure 8.1. Location of the Kipp Is
- Page 173 and 174: Table 8.4. Carpenter Brook Phase Ho
- Page 175 and 176: Table 8.5. Physical Characteristics
- Page 177 and 178: Table 8.6. AMS Dates and Calibrated
- Page 179 and 180: REFERENCES CITED Ammerman, A. J., a
- Page 181 and 182: CHAPTER 9 PITS, PLANTS, AND PLACE:
- Page 183 and 184: Thomas/Luckey Broome Tech N 0 0 50
- Page 185 and 186: confluence with the Susquehanna Riv
- Page 187 and 188: Figure 9.3. Topographic map of Broo
- Page 189 and 190: Table 9.2. Feature Types at Thomas/
- Page 191 and 192: Figure 9.4. Histogram of feature de
- Page 193 and 194: Table 9.4. Plant Remains from Thoma
- Page 195 and 196: Figure 9.7. Sample composition of n
- Page 197 and 198: Figure 9.9. Seed composition (exclu
- Page 199 and 200: suggests that the gathering of wild
- Page 201 and 202: of posts may mark remnants of tempo
- Page 203 and 204: for allowing me repeated and unteth
- Page 205 and 206: History Press, Garden City, New Yor
- Page 207 and 208:
CHAPTER 10 UPLAND LAND USE PATTERNS
- Page 209 and 210:
LOCAL LEVEL ANALYSIS Local level an
- Page 211 and 212:
N104 E101 Unit 19A Unit 7A Unit 12A
- Page 213 and 214:
Table 10.2. Park Creek II Feature A
- Page 215 and 216:
Fea. 2 Fea. 5 0 1 2 N Figure 10.4.
- Page 217 and 218:
encounterlike hunting/butchering st
- Page 219 and 220:
END NOTES 1. A village is defined a
- Page 221 and 222:
Perrelli, D. J. (1994). Gender, Mob
- Page 223 and 224:
CHAPTER 11 EARLY LATE PREHISTORIC S
- Page 225 and 226:
Table 11.1. Upper Susquehanna Site
- Page 227 and 228:
Table 11.2. Summary of Late Middle
- Page 229 and 230:
Table 11.3. Settlement Features of
- Page 231 and 232:
approximately 1,000 sq. ft, there i
- Page 233 and 234:
Table 11.5. Summary of Seed Identif
- Page 235 and 236:
importance of hunting and hunting-r
- Page 237 and 238:
portion of the Susquehanna Valley,
- Page 239 and 240:
Herrick, J. W., and Snow, D. R. (19
- Page 241 and 242:
CHAPTER 12 WOODLAND PERIOD SETTLEME
- Page 243 and 244:
oundaries were given. According to
- Page 245 and 246:
Table 12.1: Selected Radiocarbon an
- Page 247 and 248:
shads and herrings of the family Cl
- Page 249 and 250:
consists of large concentrations of
- Page 251 and 252:
(1990) survey of recorded sites in
- Page 253 and 254:
York State 92:1-8. Busby, M. (1966)
- Page 255 and 256:
CHAPTER 13 PALEOETHNOBOTANICAL INDI
- Page 257 and 258:
Figure 13.1. Forest regions of the
- Page 259 and 260:
Table 13.1. Distribution of Nut Tre
- Page 261 and 262:
ation in feature contents. For mult
- Page 263 and 264:
Figure 13.4. Nutshell density (gray
- Page 265 and 266:
Figure 13.5. Seed density and maize
- Page 267 and 268:
Table 13.3. Seed Indicators-Maine S
- Page 269 and 270:
Table 13.4. Broome Tech Site: Selec
- Page 271 and 272:
6, and it occurred in 58 percent of
- Page 273 and 274:
Table 13.6. Continued Site Uncalibr
- Page 275 and 276:
Acknowledgments I thank John Hart f
- Page 277 and 278:
y K. J. Gremillion, pp. 161-178. Th
- Page 279 and 280:
CHAPTER 14 FROM HUNTER-GATHERER CAM
- Page 281 and 282:
Figure 14.1. Distribution of select
- Page 283 and 284:
available to Ceci were simply too l
- Page 285 and 286:
the AMS date of A.D. 1185 (A.D. 127
- Page 287 and 288:
Table 14.1. Continued Site Lab C14
- Page 289 and 290:
within single settlements remains e
- Page 291 and 292:
noncoastal residential sites certai
- Page 293 and 294:
Figure 14.3. Two stratigraphic prof
- Page 295 and 296:
to the Maritime Provinces on the Gu
- Page 297 and 298:
other related questions yet, and so
- Page 299 and 300:
Northeast Historical Archaeology 21
- Page 301 and 302:
Thomas, P. A. (1976). Contrastive s
- Page 303 and 304:
CHAPTER 15 “towns they have none
- Page 305 and 306:
Table 15.1. Key to Figure 15.1: Arc
- Page 307 and 308:
Maize will normally not preserve fo
- Page 309 and 310:
artifacts. Cowie (2000) suggests th
- Page 311 and 312:
creativity to resolve, but is also
- Page 313 and 314:
Ph.D. dissertation, Department of A
- Page 315 and 316:
CHAPTER 16 OUT OF THE BLUE AND INTO
- Page 317 and 318:
Figure 16.2. Map of the Bliss Islan
- Page 319 and 320:
shell-bearing sites located on the
- Page 321 and 322:
site. Middle Maritime Woodland occu
- Page 323 and 324:
(e.g., Black 1992:190) limit and co
- Page 325 and 326:
Table 16.3. Faunal Remains Associat
- Page 327 and 328:
and often poor vertebrate faunal pr
- Page 329 and 330:
the Maine/Maritimes area have argue
- Page 331 and 332:
SE: warm season (Rojo 1987:221); sp
- Page 333 and 334:
Ethnohistory 36:257-284. Bourque, B
- Page 335 and 336:
CHAPTER 17 ABORIGINAL LAND AND RESO
- Page 337 and 338:
Table 17.1. Chronological and Ceram
- Page 339 and 340:
Among the food plants listed above,
- Page 341 and 342:
species, the American eel (Anguilla
- Page 343 and 344:
the Early Woodland period. Tools ma
- Page 345 and 346:
Copper Resources Throughout the Lat
- Page 347 and 348:
midden deposits were located along
- Page 349 and 350:
a model with two distinct populatio
- Page 351 and 352:
Table 17.2. Summary of Landscape an
- Page 353 and 354:
File Report 93-1, Fredericton. Alle
- Page 355 and 356:
Anthropology, Temple University, Ph
- Page 357 and 358:
stone age found at Maquapit Lake. N
- Page 359 and 360:
CHAPTER 18 MAIZE AND VILLAGES: A Su
- Page 361 and 362:
use of the term “small village”
- Page 363 and 364:
1325 [1425] 1460) (Boyd et al. 1998
- Page 365 and 366:
several centuries after its first a
- Page 367 and 368:
from excavations at village sites h
- Page 369 and 370:
133-156. New York State Museum Bull
- Page 371 and 372:
longhouses. American Antiquity 55:4
- Page 373 and 374:
CONTRIBUTORS Timothy J. Abel. Carth