Concrete Plant + Precast Technology Betonwerk ... - BFT International
Concrete Plant + Precast Technology Betonwerk ... - BFT International
Concrete Plant + Precast Technology Betonwerk ... - BFT International

Sie wollen auch ein ePaper? Erhöhen Sie die Reichweite Ihrer Titel.
YUMPU macht aus Druck-PDFs automatisch weboptimierte ePaper, die Google liebt.
54. BetonTage Kongressunterlagen |<br />
duced CO 2 emissions are generated in the production of<br />
lime from limestone (CaCO 3 CaO + CO 2 ) and must be<br />
taken into account for the purpose of balancing. Furthermore,<br />
it is apparent that, in the production of reinforced<br />
concrete pipes, the emissions from the steel account for<br />
30% of total CO 2 emissions. The CO 2 emissions from electricity<br />
generation for concrete and reinforced concrete<br />
pipes are equally shared between the cement and concrete<br />
plant.<br />
Energy consumption and CO2 emissions<br />
per meter of straight piping run<br />
As the energy consumption and CO 2 emissions documented<br />
for various materials can only be compared for<br />
the specifi c product, both parameters are indicated relative<br />
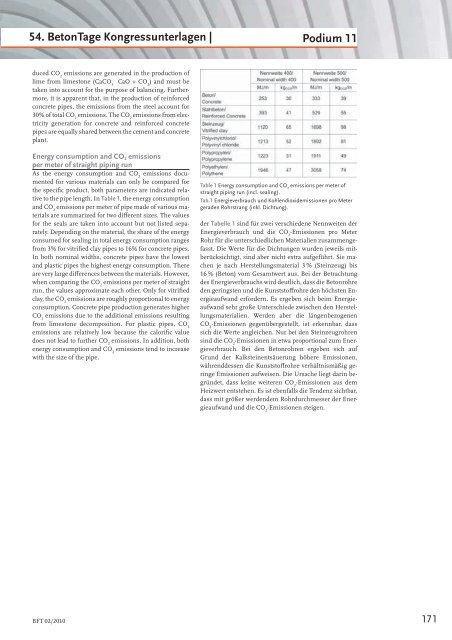
to the pipe length. In Table 1, the energy consumption<br />
and CO 2 emissions per meter of pipe made of various materials<br />
are summarized for two diff erent sizes. The values<br />
for the seals are taken into account but not listed separately.<br />
Depending on the material, the share of the energy<br />
consumed for sealing in total energy consumption ranges<br />
from 3% for vitrifi ed clay pipes to 16% for concrete pipes.<br />
In both nominal widths, concrete pipes have the lowest<br />
and plastic pipes the highest energy consumption. There<br />
are very large diff erences between the materials. However,<br />
when comparing the CO 2 emissions per meter of straight<br />
run, the values approximate each other. Only for vitrifi ed<br />
clay, the CO 2 emissions are roughly proportional to energy<br />
consumption. <strong>Concrete</strong> pipe production generates higher<br />
CO 2 emissions due to the additional emissions resulting<br />
from limestone decomposition. For plastic pipes, CO 2<br />
emissions are relatively low because the calorifi c value<br />
does not lead to further CO 2 emissions. In addition, both<br />
energy consumption and CO 2 emissions tend to increase<br />
with the size of the pipe.<br />
<strong>BFT</strong> 02/2010<br />
Podium 11<br />
Table 1 Energy consumption and CO 2 emissions per meter of<br />
straight piping run (incl. sealing).<br />
Tab.1 Energieverbrauch und Kohlendioxidemissionen pro Meter<br />
geraden Rohrstrang (inkl. Dichtung).<br />
der Tabelle 1 sind für zwei verschiedene Nennweiten der<br />
Energieverbrauch und die CO 2 -Emissionen pro Meter<br />
Rohr für die unterschiedlichen Materialien zusammengefasst.<br />
Die Werte für die Dichtungen wurden jeweils mitberücksichtigt,<br />
sind aber nicht extra aufgeführt. Sie machen<br />
je nach Herstellungsmaterial 3 % (Steinzeug) bis<br />
16 % (Beton) vom Gesamtwert aus. Bei der Betrachtung<br />
des Energieverbrauchs wird deutlich, dass die Betonrohre<br />
den geringsten und die Kunststoff rohre den höchsten Energieaufwand<br />
erfordern. Es ergeben sich beim Energieaufwand<br />
sehr große Unterschiede zwischen den Herstellungsmaterialien.<br />
Werden aber die längenbezogenen<br />
CO 2 -Emissionen gegenübergestellt, ist erkennbar, dass<br />
sich die Werte angleichen. Nur bei den Steinzeugrohren<br />
sind die CO 2 -Emissionen in etwa proportional zum Energieverbrauch.<br />
Bei den Betonrohren ergeben sich auf<br />
Grund der Kalksteinentsäuerung höhere Emissionen,<br />
währenddessen die Kunststoff rohre verhältnismäßig geringe<br />
Emissionen aufweisen. Die Ursache liegt darin begründet,<br />
dass keine weiteren CO 2 -Emissionen aus dem<br />
Heizwert entstehen. Es ist ebenfalls die Tendenz sichtbar,<br />
dass mit größer werdendem Rohrdurchmesser der Energieaufwand<br />
und die CO 2 -Emissionen steigen.<br />
171