Effet chez le porcelet d'une exposition à un régime co-contaminé en ...
Effet chez le porcelet d'une exposition à un régime co-contaminé en ...
Effet chez le porcelet d'une exposition à un régime co-contaminé en ...

Create successful ePaper yourself
Turn your PDF publications into a flip-book with our unique Google optimized e-Paper software.
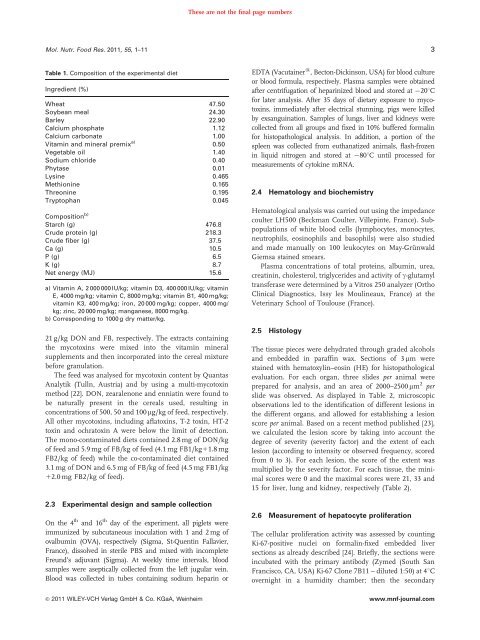
These are not the final page numbersMol. Nutr. Food Res. 2011, 55, 1–11 3Tab<strong>le</strong> 1. Composition of the experim<strong>en</strong>tal dietIngredi<strong>en</strong>t (%)Wheat 47.50Soybean meal 24.30Bar<strong>le</strong>y 22.90Calcium phosphate 1.12Calcium carbonate 1.00Vitamin and mineral premix a) 0.50Vegetab<strong>le</strong> oil 1.40Sodium chloride 0.40Phytase 0.01Lysine 0.465Methionine 0.165Threonine 0.195Tryptophan 0.045Composition b)Starch (g) 476.8Crude protein (g) 218.3Crude fiber (g) 37.5Ca (g) 10.5P (g) 6.5K (g) 8.7Net <strong>en</strong>ergy (MJ) 15.6a) Vitamin A, 2 000 000 IU/kg; vitamin D3, 400 000 IU/kg; vitaminE, 4000 mg/kg; vitamin C, 8000 mg/kg; vitamin B1, 400 mg/kg;vitamin K3, 400 mg/kg; iron, 20 000 mg/kg; <strong>co</strong>pper, 4000 mg/kg; zinc, 20 000 mg/kg; manganese, 8000 mg/kg.b) Corresponding to 1000 g dry matter/kg.21 g/kg DON and FB, respectively. The extracts <strong>co</strong>ntainingthe my<strong>co</strong>toxins were mixed into the vitamin mineralsupp<strong>le</strong>m<strong>en</strong>ts and th<strong>en</strong> in<strong>co</strong>rporated into the cereal mixturebefore granulation.The feed was analysed for my<strong>co</strong>toxin <strong>co</strong>nt<strong>en</strong>t by QuantasAnalytik (Tulln, Austria) and by using a multi-my<strong>co</strong>toxinmethod [22]. DON, zeara<strong>le</strong>none and <strong>en</strong>niatin were fo<strong>un</strong>d tobe naturally pres<strong>en</strong>t in the cereals used, resulting in<strong>co</strong>nc<strong>en</strong>trations of 500, 50 and 100 mg/kg of feed, respectively.All other my<strong>co</strong>toxins, including aflatoxins, T-2 toxin, HT-2toxin and ochratoxin A were below the limit of detection.The mono-<strong>co</strong>ntaminated diets <strong>co</strong>ntained 2.8 mg of DON/kgof feed and 5.9 mg of FB/kg of feed (4.1 mg FB1/kg11.8 mgFB2/kg of feed) whi<strong>le</strong> the <strong>co</strong>-<strong>co</strong>ntaminated diet <strong>co</strong>ntained3.1 mg of DON and 6.5 mg of FB/kg of feed (4.5 mg FB1/kg12.0 mg FB2/kg of feed).2.3 Experim<strong>en</strong>tal design and samp<strong>le</strong> <strong>co</strong>l<strong>le</strong>ctionOn the 4 th and 16 th day of the experim<strong>en</strong>t, all pig<strong>le</strong>ts wereimm<strong>un</strong>ized by subcutaneous inoculation with 1 and 2 mg ofovalbumin (OVA), respectively (Sigma, St-Qu<strong>en</strong>tin Fallavier,France), dissolved in steri<strong>le</strong> PBS and mixed with in<strong>co</strong>mp<strong>le</strong>teFre<strong>un</strong>d’s adjuvant (Sigma). At weekly time intervals, bloodsamp<strong>le</strong>s were aseptically <strong>co</strong>l<strong>le</strong>cted from the <strong>le</strong>ft jugular vein.Blood was <strong>co</strong>l<strong>le</strong>cted in tubes <strong>co</strong>ntaining sodium heparin or& 2011 WILEY-VCH Verlag GmbH & Co. KGaA, WeinheimEDTA (Vacutainer s , Becton-Dickinson, USA) for blood cultureor blood formula, respectively. Plasma samp<strong>le</strong>s were obtainedafter c<strong>en</strong>trifugation of heparinized blood and stored at 201Cfor later analysis. After 35 days of dietary exposure to my<strong>co</strong>toxins,immediately after e<strong>le</strong>ctrical st<strong>un</strong>ning, pigs were kil<strong>le</strong>dby exsanguination. Samp<strong>le</strong>s of l<strong>un</strong>gs, liver and kidneys were<strong>co</strong>l<strong>le</strong>cted from all groups and fixed in 10% buffered formalinfor histopathological analysis. In addition, a portion of thesp<strong>le</strong><strong>en</strong> was <strong>co</strong>l<strong>le</strong>cted from euthanatized animals, flash-froz<strong>en</strong>in liquid nitrog<strong>en</strong> and stored at 801C <strong>un</strong>til processed formeasurem<strong>en</strong>ts of cytokine mRNA.2.4 Hematology and biochemistryHematological analysis was carried out using the impedance<strong>co</strong>ulter LH500 (Beckman Coulter, Vil<strong>le</strong>pinte, France). Subpopulationsof white blood cells (lymphocytes, monocytes,neutrophils, eosinophils and basophils) were also studiedand made manually on 100 <strong>le</strong>ukocytes on May-Gr.<strong>un</strong>waldGiemsa stained smears.Plasma <strong>co</strong>nc<strong>en</strong>trations of total proteins, albumin, urea,creatinin, cho<strong>le</strong>sterol, triglycerides and activity of g-glutamyltransferase were determined by a Vitros 250 analyzer (OrthoClinical Diagnostics, Issy <strong>le</strong>s Moulineaux, France) at theVeterinary School of Toulouse (France).2.5 HistologyThe tissue pieces were dehydrated through graded al<strong>co</strong>holsand embedded in paraffin wax. Sections of 3 mm werestained with hematoxylin–eosin (HE) for histopathologica<strong>le</strong>valuation. For each organ, three slides per animal wereprepared for analysis, and an area of 2000–2500 mm 2 perslide was observed. As displayed in Tab<strong>le</strong> 2, micros<strong>co</strong>pi<strong>co</strong>bservations <strong>le</strong>d to the id<strong>en</strong>tification of differ<strong>en</strong>t <strong>le</strong>sions inthe differ<strong>en</strong>t organs, and allowed for establishing a <strong>le</strong>sions<strong>co</strong>re per animal. Based on a rec<strong>en</strong>t method published [23],we calculated the <strong>le</strong>sion s<strong>co</strong>re by taking into ac<strong>co</strong><strong>un</strong>t thedegree of severity (severity factor) and the ext<strong>en</strong>t of each<strong>le</strong>sion (ac<strong>co</strong>rding to int<strong>en</strong>sity or observed frequ<strong>en</strong>cy, s<strong>co</strong>redfrom 0 to 3). For each <strong>le</strong>sion, the s<strong>co</strong>re of the ext<strong>en</strong>t wasmultiplied by the severity factor. For each tissue, the minimals<strong>co</strong>res were 0 and the maximal s<strong>co</strong>res were 21, 33 and15 for liver, l<strong>un</strong>g and kidney, respectively (Tab<strong>le</strong> 2).2.6 Measurem<strong>en</strong>t of hepatocyte proliferationThe cellular proliferation activity was assessed by <strong>co</strong><strong>un</strong>tingKi-67-positive nuc<strong>le</strong>i on formalin-fixed embedded liversections as already described [24]. Briefly, the sections wereincubated with the primary antibody (Zymed (South SanFrancis<strong>co</strong>, CA, USA) Ki-67 Clone 7B11 – diluted 1:50) at 41Covernight in a humidity chamber; th<strong>en</strong> the se<strong>co</strong>ndarywww.mnf-journal.<strong>co</strong>m