la canast - Instituto Politécnico Nacional
la canast - Instituto Politécnico Nacional
la canast - Instituto Politécnico Nacional
- No tags were found...

You also want an ePaper? Increase the reach of your titles
YUMPU automatically turns print PDFs into web optimized ePapers that Google loves.
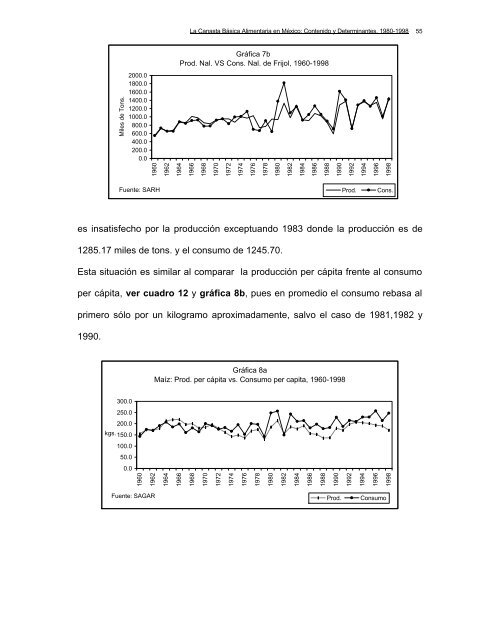
La Canasta Básica Alimentaria en México: Contenido y Determinantes, 1980-1998 55<br />
Gráfica 7b<br />
Prod. Nal. VS Cons. Nal. de Frijol, 1960-1998<br />
Miles de Tons.<br />
2000.0<br />
1800.0<br />
1600.0<br />
1400.0<br />
1200.0<br />
1000.0<br />
800.0<br />
600.0<br />
400.0<br />
200.0<br />
0.0<br />
1960<br />
1962<br />
1964<br />
1966<br />
1968<br />
1970<br />
1972<br />
1974<br />
1976<br />
1978<br />
1980<br />
1982<br />
1984<br />
1986<br />
1988<br />
1990<br />
1992<br />
1994<br />
1996<br />
1998<br />
Fuente: SARH<br />
Prod.<br />
Cons.<br />
es insatisfecho por <strong>la</strong> producción exceptuando 1983 donde <strong>la</strong> producción es de<br />
1285.17 miles de tons. y el consumo de 1245.70.<br />
Esta situación es simi<strong>la</strong>r al comparar <strong>la</strong> producción per cápita frente al consumo<br />
per cápita, ver cuadro 12 y gráfica 8b, pues en promedio el consumo rebasa al<br />
primero sólo por un kilogramo aproximadamente, salvo el caso de 1981,1982 y<br />
1990.<br />
Gráfica 8a<br />
Maíz: Prod. per cápita vs. Consumo per capita, 1960-1998<br />
300.0<br />
250.0<br />
200.0<br />
kgs. 150.0<br />
100.0<br />
50.0<br />
0.0<br />
1960<br />
1962<br />
1964<br />
1966<br />
1968<br />
1970<br />
1972<br />
1974<br />
1976<br />
1978<br />
1980<br />
1982<br />
1984<br />
1986<br />
1988<br />
1990<br />
1992<br />
1994<br />
1996<br />
1998<br />
Fuente: SAGAR<br />
Prod.<br />
Consumo