la canast - Instituto Politécnico Nacional
la canast - Instituto Politécnico Nacional
la canast - Instituto Politécnico Nacional
- No tags were found...

Create successful ePaper yourself
Turn your PDF publications into a flip-book with our unique Google optimized e-Paper software.
La Canasta Básica Alimentaria en México: Contenido y Determinantes, 1980-1998 83<br />
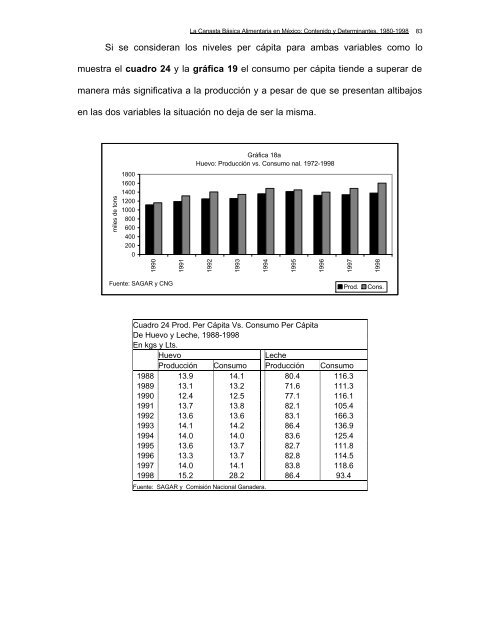
Si se consideran los niveles per cápita para ambas variables como lo<br />
muestra el cuadro 24 y <strong>la</strong> gráfica 19 el consumo per cápita tiende a superar de<br />
manera más significativa a <strong>la</strong> producción y a pesar de que se presentan altibajos<br />
en <strong>la</strong>s dos variables <strong>la</strong> situación no deja de ser <strong>la</strong> misma.<br />
Gráfica 18a<br />
Huevo: Producción vs. Consumo nal. 1972-1998<br />
miles de tons<br />
1800<br />
1600<br />
1400<br />
1200<br />
1000<br />
800<br />
600<br />
400<br />
200<br />
0<br />
1990<br />
1991<br />
1992<br />
1993<br />
1994<br />
1995<br />
1996<br />
1997<br />
1998<br />
Fuente: SAGAR y CNG<br />
Prod.<br />
Cons.<br />
Cuadro 24 Prod. Per Cápita Vs. Consumo Per Cápita<br />
De Huevo y Leche, 1988-1998<br />
En kgs y Lts.<br />
Huevo<br />
Leche<br />
Producción Consumo Producción Consumo<br />
1988 13.9 14.1 80.4 116.3<br />
1989 13.1 13.2 71.6 111.3<br />
1990 12.4 12.5 77.1 116.1<br />
1991 13.7 13.8 82.1 105.4<br />
1992 13.6 13.6 83.1 166.3<br />
1993 14.1 14.2 86.4 136.9<br />
1994 14.0 14.0 83.6 125.4<br />
1995 13.6 13.7 82.7 111.8<br />
1996 13.3 13.7 82.8 114.5<br />
1997 14.0 14.1 83.8 118.6<br />
1998 15.2 28.2 86.4 93.4<br />
Fuente: SAGAR y Comisión <strong>Nacional</strong> Ganadera.