la canast - Instituto Politécnico Nacional
la canast - Instituto Politécnico Nacional
la canast - Instituto Politécnico Nacional
- No tags were found...

Create successful ePaper yourself
Turn your PDF publications into a flip-book with our unique Google optimized e-Paper software.
La Canasta Básica Alimentaria en México: Contenido y Determinantes, 1980-1998 82<br />
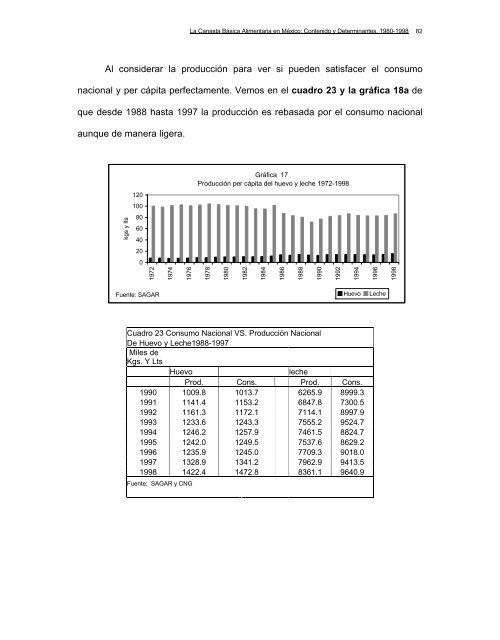
Al considerar <strong>la</strong> producción para ver si pueden satisfacer el consumo<br />
nacional y per cápita perfectamente. Vemos en el cuadro 23 y <strong>la</strong> gráfica 18a de<br />
que desde 1988 hasta 1997 <strong>la</strong> producción es rebasada por el consumo nacional<br />
aunque de manera ligera.<br />
Gráfica 17<br />
Producción per cápita del huevo y leche 1972-1998<br />
120<br />
100<br />
kgs y lts<br />
80<br />
60<br />
40<br />
20<br />
0<br />
1972<br />
1974<br />
1976<br />
1978<br />
1980<br />
1982<br />
1984<br />
1986<br />
1988<br />
1990<br />
1992<br />
1994<br />
1996<br />
1998<br />
Fuente: SAGAR<br />
Huevo<br />
Leche<br />
Cuadro 23 Consumo <strong>Nacional</strong> VS. Producción <strong>Nacional</strong><br />
De Huevo y Leche1988-1997<br />
Miles de<br />
Kgs. Y Lts<br />
Huevo<br />
leche<br />
Prod. Cons. Prod. Cons.<br />
1990 1009.8 1013.7 6265.9 8999.3<br />
1991 1141.4 1153.2 6847.8 7300.5<br />
1992 1161.3 1172.1 7114.1 8997.9<br />
1993 1233.6 1243.3 7555.2 9524.7<br />
1994 1246.2 1257.9 7461.5 8824.7<br />
1995 1242.0 1249.5 7537.6 8629.2<br />
1996 1235.9 1245.0 7709.3 9018.0<br />
1997 1328.9 1341.2 7962.9 9413.5<br />
1998 1422.4 1472.8 8361.1 9640.9<br />
Fuente: SAGAR y CNG