- Page 2 and 3: INFORME DE GESTIÓN 2004 - 2005 Edu
- Page 4 and 5: GABINETE ANTERIOR
- Page 6 and 7: GABINETE MINISTERIAL 14 de junio de
- Page 8 and 9: P R E S I D E N C I A D E L A R E P
- Page 10 and 11: P R E S I D E N C I A D E L A R E P
- Page 12 and 13: Al primer trimestre de 2005, la eje
- Page 14 and 15: por tributos omitidos, de una recau
- Page 16 and 17: iii) D.S. Nº 28224 para asignar re
- Page 18 and 19: En zonas expulsoras y de riesgo, se
- Page 20 and 21: Se está gestionando la firma de co
- Page 22 and 23: A fin de impulsar el Programa de Fo
- Page 24 and 25: V. RECURSOS NATURALES, MEDIO AMBIEN
- Page 26 and 27: desarrollo nacional, y iii) se conf
- Page 28 and 29: 8.3. Administración de Personal de
- Page 30 and 31: fortalecimiento de la transparencia
- Page 32 and 33: 1. ENTORNO INTERNACIONAL P R E S I
- Page 34 and 35: La aprobación de la nueva Ley de H
- Page 36 and 37: El déficit de pensiones continúa
- Page 38 and 39: su participación de 4,2% a 5,6% de
- Page 40 and 41: metropolitanas y mayores. Asimismo,
- Page 42 and 43: ANEXOS Cuadro 1 Balanza de Pagos: C
- Page 44 and 45: Cuadro 4 Importaciones según Uso o
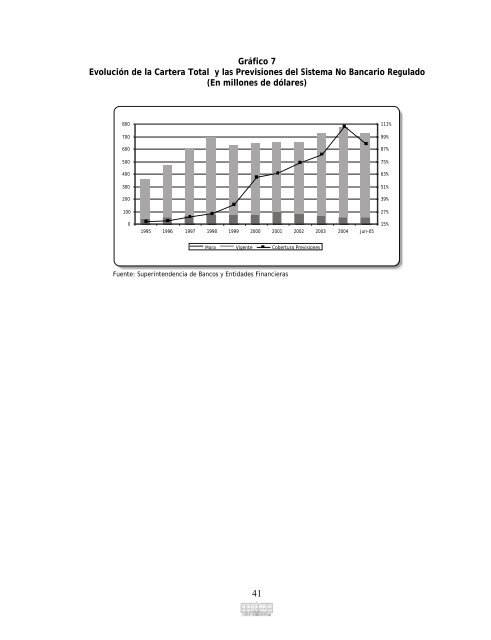
- Page 46 and 47: Gráfico 3 Evolución de las Obliga
- Page 50 and 51: Principales Objetivos P R E S I D E
- Page 52 and 53: los ámbitos de: a) Consultas polí
- Page 54 and 55: y la creación de mayor valor agreg
- Page 56 and 57: avanza en el tema fronterizo. Los p
- Page 58 and 59: nombramiento de su sucesor. El Card
- Page 60 and 61: • Informes de seguimiento y evalu
- Page 62 and 63: Tareas a Futuro EN EL ÁMBITO MULTI
- Page 64 and 65: Principales Objetivos P R E S I D E
- Page 66 and 67: • Coordinación en la atención d
- Page 68 and 69: 5. Promover una cultura de gestión
- Page 70 and 71: compromisos y metas estratégicas d
- Page 72 and 73: Tareas a Futuro COORDINACIÓN GUBER
- Page 74 and 75: • Resultados, además de la publi
- Page 76 and 77: ESTRATEGIA DE DERECHOS HUMANOS •
- Page 78 and 79: 3. Realizar las tareas necesarias p
- Page 80 and 81: • De conformidad a lo previsto en
- Page 82 and 83: • El nuevo enfoque planteado est
- Page 84 and 85: • Tareas específicas y del secto
- Page 86 and 87: • Este trabajo se realizó a la f
- Page 88 and 89: ACTIVIDAD 02 “DESARROLLO DEL CAPI
- Page 90 and 91: • Identificación de los principa
- Page 92 and 93: Principales Objetivos P R E S I D E
- Page 94 and 95: 9. Capacitar a privados de libertad
- Page 96 and 97: Gobierno. Asimismo, carnetización
- Page 98:
productor, y en el caso de los Yung
- Page 101 and 102:
Ministerio de Defensa Nacional Dire
- Page 103 and 104:
VICEMINISTERIO DE DEFENSA Principal
- Page 105 and 106:
Información Geográfica, Sistema d
- Page 107 and 108:
• Búsqueda de socios inversionis
- Page 109 and 110:
Viceministerio de Presupuesto y Con
- Page 111 and 112:
• Diseño de un sistema informát
- Page 113 and 114:
Tareas a Futuro FORTALECIMIENTO INS
- Page 115 and 116:
• Elaboración y aprobación de l
- Page 117 and 118:
ESTABILIDAD ECONÓMICA Y SOCIAL •
- Page 119 and 120:
ecursos de análisis y la coordinac
- Page 121 and 122:
de la Reforma de la Administración
- Page 123 and 124:
suscritos por Bolivia y los diferen
- Page 125 and 126:
Acciones Desarrolladas INVERSIÓN P
- Page 127 and 128:
de Pensiones, Valores y Seguros (SP
- Page 129 and 130:
• Desarrollo del Programa de Supe
- Page 131 and 132:
5. Desarrollar y ejecutar el Plan I
- Page 133 and 134:
a) la implantación de sistemas inf
- Page 135 and 136:
• Desarrollo de operativos de con
- Page 137 and 138:
• Monetización de la Donación d
- Page 139 and 140:
apoyar de forma efectiva a la toma
- Page 141 and 142:
informáticos, la misma que es admi
- Page 143 and 144:
2. Gestionar el pago de rentas del
- Page 145 and 146:
ejecución del proyecto de Fortalec
- Page 147 and 148:
para que bajo un solo concepto se a
- Page 149 and 150:
administración y difusión de los
- Page 151 and 152:
nacional por 11 instituciones educa
- Page 153 and 154:
Viceministerio de Planificación y
- Page 155 and 156:
• Capacitación y asistencia téc
- Page 157 and 158:
DESARROLLO FORESTAL • Elaboració
- Page 159 and 160:
PROYECTO DE MEDIO AMBIENTE INDUSTRI
- Page 161 and 162:
• Fortalecimiento del Régimen Fo
- Page 163 and 164:
y Pueblos Indígenas (LACPI) se rea
- Page 165 and 166:
autoridades municipales de ciudades
- Page 167 and 168:
• Elaboración de material educat
- Page 169 and 170:
• Ejecución del Proyecto de Apoy
- Page 171 and 172:
• Implementación del programa de
- Page 173 and 174:
• Elaboración del proyecto de De
- Page 175 and 176:
• En cuanto a temas de saneamient
- Page 177 and 178:
9. Ejecutar proyectos que abarquen,
- Page 179 and 180:
de cuentas distorsionantes de Balan
- Page 181 and 182:
• Implementación de nuevas polí
- Page 183 and 184:
Viceministerio de Industria, Comerc
- Page 185 and 186:
8. Promover el desarrollo del contr
- Page 187 and 188:
capacitación sobre el Registro Amb
- Page 189 and 190:
3. Incrementar la conciencia sobre
- Page 191 and 192:
2. Diseminar las ventajas de realiz
- Page 193 and 194:
• Desarrollo de actividades en el
- Page 195 and 196:
y financiamiento, b) Promover el de
- Page 197 and 198:
• Iniciación de gestión ante Ca
- Page 199 and 200:
• Introducción en todas las Mesa
- Page 201 and 202:
• Próxima realización con PROCA
- Page 203 and 204:
• Institucionalización de la Red
- Page 205 and 206:
• Consolidación del Plan Naciona
- Page 207 and 208:
MEJORA DEL ENTORNO COMPETITIVO DEL
- Page 209 and 210:
y apoyo a la comercialización y ot
- Page 211 and 212:
la MyPE, sin embargo su misión no
- Page 213 and 214:
Tareas a Futuro • En el área fun
- Page 215 and 216:
6. Administrar el Programa de Turis
- Page 217 and 218:
210
- Page 219 and 220:
Ministerio de Servicios y Obras Pú
- Page 221 and 222:
Tareas a futuro POLÍTICAS PARA LA
- Page 223 and 224:
Acciones Desarrolladas ELECTRICIDAD
- Page 225 and 226:
En asignaciones de gas oil: • Pre
- Page 227 and 228:
• Proceso de difusión a nivel na
- Page 229 and 230:
3. Aprobar los requisitos para emit
- Page 231 and 232:
• Gestión de recursos ante el Fo
- Page 233 and 234:
• Construcción de los Puentes Ya
- Page 235 and 236:
AASANA Principales Objetivos 1. Dir
- Page 237 and 238:
• Automatización de Gestión de
- Page 239 and 240:
Ministerio de Educación Dirección
- Page 241 and 242:
• Concretización de la firma de
- Page 243 and 244:
• Coordinación con el Ministerio
- Page 245 and 246:
Ministerio de Salud y Deportes Dire
- Page 247 and 248:
• Incorporación a la carrera adm
- Page 249 and 250:
• Aprobación del Sistema Naciona
- Page 251 and 252:
CAJA NACIONAL DE SALUD Principales
- Page 253 and 254:
• Conclusión del saneamiento de
- Page 255 and 256:
248
- Page 257 and 258:
Viceministerio de Trabajo y Empleo
- Page 259 and 260:
• Verificación del cumplimiento
- Page 261 and 262:
Tareas a Futuro • Continuación d
- Page 263 and 264:
Ética en las entidades estatales c
- Page 265 and 266:
Ministerio de Asuntos Campesinos y
- Page 267 and 268:
• Iniciación de la remodelación
- Page 269 and 270:
afectados por Fenómenos Climático
- Page 271 and 272:
en el sector (MACA, SEDAG´s, Munic
- Page 273 and 274:
• Incorporación de mejoras concr
- Page 275 and 276:
En este sentido, se ha viabilizado
- Page 277 and 278:
• En el marco del “Componente d
- Page 279 and 280:
❏ Erradicación de 8.437 hectáre
- Page 281 and 282:
Ministerio de Hidrocarburos Direcci
- Page 283 and 284:
• Los montos recaudados en la ges
- Page 285 and 286:
• Exportación de Gas Natural: A
- Page 287 and 288:
280
- Page 289 and 290:
Ministerio de Minería y Metalurgia
- Page 291 and 292:
Tareas a Futuro • Elaboración de
- Page 293 and 294:
Tareas a futuro • Elaboración de
- Page 295 and 296:
• Adquisición de cartografía di
- Page 297 and 298:
Ministerio de Participación Popula
- Page 299 and 300:
• Elaboración del Modelo de Gest
- Page 301 and 302:
el proceso de capacitación contrat
- Page 303 and 304:
se avanzó en el seguimiento a las
- Page 305 and 306:
los actuales FNDR y FPS, sirve adem
- Page 307 and 308:
aplicación de sistemas y métodos
- Page 309 and 310:
Acciones Desarrolladas El PLANE se
- Page 311 and 312:
Ministerio de Asuntos Indígenas y
- Page 313 and 314:
Acciones Desarrolladas • Firma de
- Page 315 and 316:
❏ Problemáticas alrededor de la
- Page 317 and 318:
310
- Page 319 and 320:
6. Promover el acceso equitativo de
- Page 321 and 322:
• Organización y conformación d
- Page 323 and 324:
316
- Page 325 and 326:
• En el marco de la transparencia
- Page 327 and 328:
de la ciudad de El Alto, que demand
- Page 329 and 330:
7. Establecer una línea base de lo
- Page 331 and 332:
de conversión de gas natural vehic
- Page 333 and 334:
326
- Page 335 and 336:
fortalecimiento de gestión municip
- Page 337 and 338:
del diseño y aplicación de polít
- Page 339 and 340:
• Gestión de la descentralizaci
- Page 341 and 342:
• Culminar con las acciones empre
- Page 343 and 344:
336
- Page 345 and 346:
i) Continuidad con relación a los
- Page 347 and 348:
Proyectos riego del Proyecto Múlti
- Page 349 and 350:
Derecho a la Identidad • Ejecuci
- Page 351 and 352:
344
- Page 353 and 354:
ÁREA DE DESARROLLO SOCIAL • Adec
- Page 355 and 356:
• Ejecución del Proyecto Puerto
- Page 357 and 358:
10. Mantener habilitados los canale
- Page 359 and 360:
• Entrega de una batería de 120
- Page 361 and 362:
ÁREA DE RECURSOS NATURALES Y MEDIO
- Page 363 and 364:
ÁREA DE DESARROLLO PRODUCTIVO E IN
- Page 365 and 366:
• El proyecto ha entrado en la fa
- Page 367 and 368:
360
- Page 369 and 370:
esolvió ochenta y cuatro (84) recu
- Page 371 and 372:
• Intercambio de experiencias con
- Page 373 and 374:
COBEE BPCO y se aprobaron las tarif
- Page 375 and 376:
asada en un modelo matemático que
- Page 377 and 378:
• Implementación y publicación
- Page 379 and 380:
SUPERINTENDENCIA DE TELECOMUNICACIO
- Page 381 and 382:
de Reguladores de Telecomunicacione
- Page 383 and 384:
• Participación como miembro act
- Page 385 and 386:
Comercio para las empresas que no e
- Page 387 and 388:
VICEMINISTERIO DE POLÍTICA TRIBUTA
- Page 389 and 390:
PRINCIPALES OBJETIVOS .............