Global Report on Human Settlements 2007 - PoA-ISS
Global Report on Human Settlements 2007 - PoA-ISS
Global Report on Human Settlements 2007 - PoA-ISS

Create successful ePaper yourself
Turn your PDF publications into a flip-book with our unique Google optimized e-Paper software.
Disaster risk: C<strong>on</strong>diti<strong>on</strong>s, trends and impacts<br />
175<br />
Deaths per milli<strong>on</strong> populati<strong>on</strong> (annual mean)<br />
1000<br />
500<br />
100<br />
50<br />
10<br />
5<br />
1<br />
0.5<br />
0.1<br />
0.05<br />
0.01<br />
0.005<br />
Guinea Bissau<br />
Norway<br />
St Kitts and Nevis<br />
Seychelles<br />
Bahamas<br />
Mauritius<br />
Trinidad & Tobago<br />
Cyprus<br />
Bulgaria<br />
Netherlands<br />
Iraq<br />
Vanuatu<br />
Canada<br />
Germany<br />
Swaziland<br />
Djibouti<br />
United<br />
Kingdom<br />
Nigeria<br />
H<strong>on</strong>duras<br />
Japan<br />
United States<br />
Mexico<br />
Mozambique<br />
Armenia<br />
Venezuela<br />
Iran<br />
India<br />
China<br />
Sudan<br />
DP Korea<br />
Ethiopia<br />
Bangladesh<br />
Low human development<br />
Medium human development<br />
High human development<br />
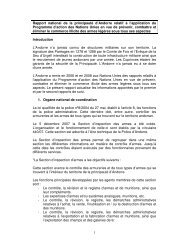
Figure 7.5<br />
Nati<strong>on</strong>al development<br />
status and natural<br />
disaster mortality<br />
(1980–2000)<br />
Source: UNDP, 2004<br />
Note: HDI ranking for<br />
Afghanistan, Democratic<br />
People’s Republic of Korea,<br />
Iraq, Liberia and Yugoslavia are<br />
from UNDP <strong>Human</strong><br />
Development report 1996, all<br />
others from UNDP <strong>Human</strong><br />
Development <str<strong>on</strong>g>Report</str<strong>on</strong>g> 2002.<br />
0.001<br />
0.05<br />
0.1<br />
0.5<br />
1<br />
5<br />
10<br />
50<br />
100<br />
Deaths (annual mean)<br />
500<br />
1000<br />
5000<br />
10,000<br />
50,000<br />
100,000<br />
The UNDP also developed the Disaster Risk Index, a<br />
pi<strong>on</strong>eer tool for assessing variati<strong>on</strong>s in disaster vulnerability<br />
according to levels of development. The index tests 24 socioec<strong>on</strong>omic<br />
variables against disaster mortality for<br />
earthquakes, flooding and windstorm at the nati<strong>on</strong>al level to<br />
identify those variables that most explained patterns of loss.<br />
For all hazard types, exposure of human populati<strong>on</strong>s to<br />
hazard-pr<strong>on</strong>e places was found to be statistically associated<br />
with mortality. Urban growth was also found to be statistically<br />
associated with risk of death from earthquakes. This<br />
work provides statistical support for the large amount of<br />
observati<strong>on</strong>al data that c<strong>on</strong>nects rapid urban growth with<br />
disaster risk, and, in particular, with losses associated with<br />
earthquakes. Disaster risks and impacts are also differentiated<br />
by levels of development and investments in risk<br />
reducti<strong>on</strong> at the city level.<br />
City-level comparis<strong>on</strong>s of disaster risk<br />
There have been few studies of the global distributi<strong>on</strong> of<br />
disaster risk for individual cities. Munich Re’s Natural<br />
Hazards Risk Index for Megacities is a rare example (see<br />
Table 7.5). 15 The Natural Hazards Risk Index includes 50<br />
participating cities and is primarily designed to compare<br />
insurance risk potential. With this caveat in mind, the index<br />
database is applied here to build up a picture of disaster risk<br />
at the city level.<br />
One achievement of the Natural Hazards Risk Index is<br />
its multi-hazard approach, covering earthquake, windstorm,<br />
flood, volcanic erupti<strong>on</strong>, bush fires and winter damage<br />
(frost). Reflecting Munich Re’s business focus, the c<strong>on</strong>ceptualizati<strong>on</strong><br />
and measurement of vulnerability is restricted to<br />
built assets, with an additi<strong>on</strong>al measure of financial<br />
exposure. The multi-hazard approach is enabled through<br />
individual assessments of vulnerability for each hazard type<br />
(for building structures and c<strong>on</strong>structi<strong>on</strong> and planning<br />
regulati<strong>on</strong>s), which are then combined with an overall<br />
assessment of the general quality of c<strong>on</strong>structi<strong>on</strong> and building<br />
density in the city to arrive at a risk index. There is some<br />
c<strong>on</strong>cern over the quality of vulnerability data available for<br />
cities; but Munich Re c<strong>on</strong>siders the results to be plausible<br />
and reflective of expert opini<strong>on</strong> <strong>on</strong> city vulnerability and risk.<br />
Using Munich Re’s methodology, results show that<br />
greatest risk has accumulated in the cities of richer<br />
countries. Only <strong>on</strong>e megacity from a n<strong>on</strong>-industrial country,<br />
Manila, is in the top ten when cities are ordered by the risk<br />
index. 16 With a view to supporting decisi<strong>on</strong>-making within<br />
the insurance sector, the Natural Hazards Risk Index understandably<br />
identifies high exposure in cities with large<br />
physical assets and commercial interests. Hence, Tokyo, San<br />
Francisco and Los Angeles have the highest Natural Hazards<br />
Risk Index values.<br />
From a human settlements perspective, Munich Re’s<br />
Natural Hazards Risk Index is less instructive than the base<br />
data held in Table 7.5. When c<strong>on</strong>sidering the vulnerability of<br />
cities in terms of the sum of different types of natural hazard<br />
exposure, high risk becomes associated with Manila, Tokyo,<br />
Kolkata, Osaka–Kobe–Kyoto, Jakarta and Dhaka, all cities in<br />
excess of 10 milli<strong>on</strong> inhabitants and with high exposure to at<br />
least two different kinds of natural hazard. There are some<br />
counterintuitive results. For example, San Francisco appears<br />
low <strong>on</strong> the list, despite high earthquake exposure, because<br />
of low exposure to other hazard types.<br />
Munich Re’s data is also useful for identifying those<br />
cities where a large natural disaster is most likely to impact<br />
negatively up<strong>on</strong> the nati<strong>on</strong>al ec<strong>on</strong>omy. Dhaka, with 60 per<br />
cent of nati<strong>on</strong>al GDP produced within the city, and with high<br />
exposure to earthquakes, tropical storms and storm surges,<br />
is a str<strong>on</strong>g candidate for a city whose risk has nati<strong>on</strong>al c<strong>on</strong>sequences.<br />
The impact of disaster is further differentiated according<br />
to the development paths and levels of disaster<br />
The impact of<br />
disaster is …<br />
differentiated<br />
according to the<br />
development paths<br />
and levels of disaster<br />
preparedness of<br />
individual cities