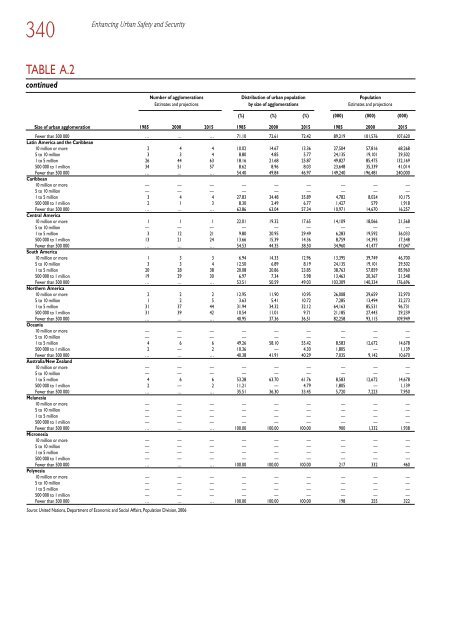
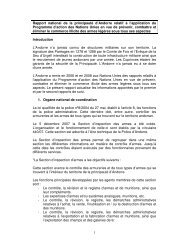
340 Enhancing Urban Safety and Security TABLE A.2 c<strong>on</strong>tinued Fewer than 500 000 … … … 71.10 72.61 72.42 89,219 101,576 107,620 Latin America and the Caribbean 10 milli<strong>on</strong> or more 2 4 4 10.02 14.67 13.36 27,504 57,816 68,268 5 to 10 milli<strong>on</strong> 3 3 4 8.80 4.85 5.77 24,135 19,101 29,502 1 to 5 milli<strong>on</strong> 26 44 63 18.16 21.68 25.87 49,827 85,475 132,169 500 000 to 1 milli<strong>on</strong> 34 51 57 8.62 8.96 8.03 23,648 35,339 41,014 Fewer than 500 000 … … … 54.40 49.84 46.97 149,240 196,481 240,000 Caribbean 10 milli<strong>on</strong> or more — — — — — — — — — 5 to 10 milli<strong>on</strong> — — — — — — — — — 1 to 5 milli<strong>on</strong> 3 4 4 27.83 34.48 35.89 4,782 8,024 10,175 500 000 to 1 milli<strong>on</strong> 2 1 3 8.30 2.49 6.77 1,427 579 1,918 Fewer than 500 000 … … … 63.86 63.04 57.34 10,971 14,670 16,257 Central America 10 milli<strong>on</strong> or more 1 1 1 22.01 19.32 17.65 14,109 18,066 21,568 5 to 10 milli<strong>on</strong> — — — — — — — — — 1 to 5 milli<strong>on</strong> 3 12 21 9.80 20.95 29.49 6,283 19,592 36,033 500 000 to 1 milli<strong>on</strong> 13 21 24 13.66 15.39 14.36 8,759 14,393 17,548 Fewer than 500 000 … … … 54.53 44.35 38.50 34,960 41,477 47,047 South America 10 milli<strong>on</strong> or more 1 3 3 6.94 14.33 12.96 13,395 39,749 46,700 5 to 10 milli<strong>on</strong> 3 3 4 12.50 6.89 8.19 24,135 19,101 29,502 1 to 5 milli<strong>on</strong> 20 28 38 20.08 20.86 23.85 38,763 57,859 85,960 500 000 to 1 milli<strong>on</strong> 19 29 30 6.97 7.34 5.98 13,463 20,367 21,548 Fewer than 500 000 … … … 53.51 50.59 49.03 103,309 140,334 176,696 Northern America 10 milli<strong>on</strong> or more 2 2 2 12.95 11.90 10.95 26,008 29,659 32,970 5 to 10 milli<strong>on</strong> 1 2 5 3.63 5.41 10.72 7,285 13,494 32,273 1 to 5 milli<strong>on</strong> 31 37 44 31.94 34.32 32.12 64,163 85,531 96,731 500 000 to 1 milli<strong>on</strong> 31 39 42 10.54 11.01 9.71 21,185 27,443 29,239 Fewer than 500 000 … … … 40.95 37.36 36.51 82,258 93,115 109,949 Oceania 10 milli<strong>on</strong> or more — — — — — — — — — 5 to 10 milli<strong>on</strong> — — — — — — — — — 1 to 5 milli<strong>on</strong> 4 6 6 49.26 58.10 55.42 8,583 12,672 14,678 500 000 to 1 milli<strong>on</strong> 2 — 2 10.36 — 4.30 1,805 — 1,139 Fewer than 500 000 … … … 40.38 41.91 40.29 7,035 9,142 10,670 Australia/New Zealand 10 milli<strong>on</strong> or more — — — — — — — — — 5 to 10 milli<strong>on</strong> — — — — — — — — — 1 to 5 milli<strong>on</strong> 4 6 6 53.28 63.70 61.76 8,583 12,672 14,678 500 000 to 1 milli<strong>on</strong> 2 — 2 11.21 — 4.79 1,805 — 1,139 Fewer than 500 000 … … … 35.51 36.30 33.45 5,720 7,223 7,950 Melanesia 10 milli<strong>on</strong> or more — — — — — — — — — 5 to 10 milli<strong>on</strong> — — — — — — — — — 1 to 5 milli<strong>on</strong> — — — — — — — — — 500 000 to 1 milli<strong>on</strong> — — — — — — — — — Fewer than 500 000 … … … 100.00 100.00 100.00 900 1,332 1,938 Micr<strong>on</strong>esia 10 milli<strong>on</strong> or more — — — — — — — — — 5 to 10 milli<strong>on</strong> — — — — — — — — — 1 to 5 milli<strong>on</strong> — — — — — — — — — 500 000 to 1 milli<strong>on</strong> — — — — — — — — — Fewer than 500 000 … … … 100.00 100.00 100.00 217 332 460 Polynesia 10 milli<strong>on</strong> or more — — — — — — — — — 5 to 10 milli<strong>on</strong> — — — — — — — — — 1 to 5 milli<strong>on</strong> — — — — — — — — — 500 000 to 1 milli<strong>on</strong> — — — — — — — — — Fewer than 500 000 … … … 100.00 100.00 100.00 198 255 322 Source: United Nati<strong>on</strong>s, Department of Ec<strong>on</strong>omic and Social Affairs, Populati<strong>on</strong> Divisi<strong>on</strong>, 2006 Number of agglomerati<strong>on</strong>s Distributi<strong>on</strong> of urban populati<strong>on</strong> Populati<strong>on</strong> Estimates and projecti<strong>on</strong>s by size of agglomerati<strong>on</strong>s Estimates and projecti<strong>on</strong>s (%) (%) (%) (000) (000) (000) Size of urban agglomerati<strong>on</strong> 1985 2000 2015 1985 2000 2015 1985 2000 2015
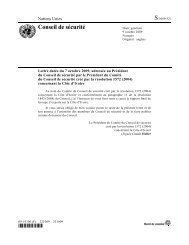
Data tables 341 TABLE A.3 Shelter Indicators Total number of households Water and sanitati<strong>on</strong> coverage World 1,568,693 2,653,762 192,576 184,059 182,630 175,921 78 83 49 59 49 54 World Major Aggregates More Developed Regi<strong>on</strong>s 469,276 601,034 28,355 23,216 19,623 16,936 100 99 100 99 97 97 Less Developed Regi<strong>on</strong>s 1,099,417 2,052,728 164,221 160,843 163,007 158,985 71 80 35 50 37 44 Least Developed Countries 121,848 288,339 21,915 24,267 28,942 33,586 52 62 28 39 12 14 Landlocked Developing Countries 65,128 142,717 9,991 11,469 13,492 15,702 56 69 32 47 24 27 Small Island Developing States 12,209 19,694 1,374 1,291 1,227 1,184 84 83 71 70 44 53 United Nati<strong>on</strong>s Regi<strong>on</strong>al Groups African States 163,509 387,272 32,596 32,827 37,107 42,760 61 71 38 46 24 29 Asian States 833,654 1,458,357 113,795 109,915 107,996 98,854 82 80 61 67 41 46 Eastern European States 133,688 145,841 5,606 1,983 710 -212 94 93 96 88 77 77 Latin American and Caribbean States 128,557 226,806 17,208 16,856 16,514 15,893 84 90 70 79 64 76 Western European and Other States 197,992 264,277 12,625 11,724 10,403 9,360 99 99 98 99 96 99 <strong>Human</strong> Development Aggregates High <strong>Human</strong> Development 438,856 602,758 30,996 28,999 25,978 23,774 98 98 96 97 92 92 Medium <strong>Human</strong> Development 982,469 1,691,491 130,896 124,509 119,645 111,792 78 82 58 66 43 52 Low <strong>Human</strong> Development 129,199 319,586 28,062 27,787 31,558 36,335 50 61 30 38 13 14 Income Aggregates High Income 364,139 496,742 24,972 23,471 20,943 19,087 100 100 100 100 97 97 Middle Income 785,958 1,314,779 98,271 91,251 88,643 83,619 86 87 76 80 60 70 Upper-middle Income 179,399 261,869 16,221 13,937 13,396 12,297 93 91 86 85 69 82 Low-middle Income 606,560 1,052,909 82,050 77,314 75,247 71,322 80 83 66 74 50 58 Low Income 416,993 839,039 69,093 69,083 72,773 72,922 55 64 28 39 15 19 Geographic Aggregates Africa 163,509 387,272 32,596 32,827 37,107 42,760 61 71 38 46 24 29 Eastern Africa 50,046 121,636 8,711 10,296 12,505 14,913 58 65 36 44 22 21 Middle Africa 19,897 58,675 4,549 5,730 6,930 8,323 40 59 19 33 8 15 Northern Africa 30,060 57,110 4,789 4,680 4,771 4,580 80 85 67 75 50 56 Southern Africa 15,120 25,358 3,235 873 566 633 78 82 42 43 28 39 Western Africa 48,386 124,495 11,311 11,249 12,334 14,312 50 63 24 34 10 14 Asia 854,279 1,493,623 116,256 112,485 110,510 101,175 82 83 59 68 46 53 Eastern Asia 431,691 737,806 57,263 53,201 53,875 48,049 83 86 62 66 57 70 South-central Asia 265,789 480,182 38,296 39,002 36,686 34,181 74 76 42 56 31 29 South-eastern Asia 119,989 201,746 15,345 14,526 13,453 12,095 82 77 57 64 29 36 Western Asia 36,809 73,889 5,352 5,756 6,496 6,849 87 91 76 84 69 78 Europe 289,818 340,219 13,533 8,836 6,404 4,640 99 99 99 96 95 92 Eastern Europe 119,901 130,818 5,179 1,730 616 -266 98 93 96 91 87 80 Northern Europe 39,990 54,891 2,692 2,615 2,407 2,332 99 99 99 95 94 95 Southern Europe 51,855 61,276 2,150 1,639 1,162 833 98 98 97 96 89 88 Western Europe 78,053 93,211 3,511 2,850 2,218 1,742 100 100 100 100 100 100 Latin America 128,557 226,806 17,208 16,856 16,514 15,893 84 90 70 79 64 76 Caribbean 10,216 15,543 1,041 942 872 785 92 92 86 88 67 74 Central America 30,456 55,358 4,199 4,372 4,366 4,132 79 90 56 69 61 78 South America 87,847 155,838 11,962 11,537 11,272 10,972 81 89 69 79 63 77 Northern America 122,085 188,393 11,849 11,894 10,903 10,249 100 100 100 100 100 97 Oceania 10,445 17,448 1,135 1,161 1,192 1,203 83 84 76 79 49 56 Australia/New Zealand 8,769 14,325 929 939 941 920 100 100 100 100 … … Melanesia 1,447 2,774 184 198 228 266 50 54 56 50 20 21 Micr<strong>on</strong>esia 106 162 10 13 11 7 85 88 63 70 25 36 Polynesia 123 187 12 11 11 10 96 95 86 95 50 66 Source: UN-Habitat, 2006. Figures in regi<strong>on</strong>al, income or development aggregates are calculated <strong>on</strong> the basis of country/area level data from Tables B.4 and B.5. Note: Lists of countries/areas in aggregates are presented in the Technical Notes. Estimates and 5-year increment Improved Improved Household projecti<strong>on</strong>s (000) drinking water sanitati<strong>on</strong> c<strong>on</strong>necti<strong>on</strong>s (000) (%) (%) (%) 2000 2030 2005- 2010- 2015- 2020- 1990 2004 1990 2004 1990 2004 2010 2015 2020 2025
- Page 3:
ENHANCING URBAN SAFETY AND SECURITY
- Page 6 and 7:
First published by Earthscan in the
- Page 8 and 9:
INTRODUCTION Enhancing Urban Safety
- Page 10 and 11:
ACKNOWLEDGEMENTS The preparation of
- Page 12 and 13:
x Enhancing Urban Safety and Securi
- Page 14 and 15:
xii Enhancing Urban Safety and Secu
- Page 16 and 17:
xiv Enhancing Urban Safety and Secu
- Page 18 and 19:
xvi Enhancing Urban Safety and Secu
- Page 20 and 21:
xviii Enhancing Urban Safety and Se
- Page 22 and 23:
LIST OF FIGURES, BOXES AND TABLES F
- Page 24 and 25:
xxii Enhancing Urban Safety and Sec
- Page 26 and 27:
xxiv Enhancing Urban Safety and Sec
- Page 28 and 29:
xxvi Enhancing Urban Safety and Sec
- Page 30 and 31:
xxviii Enhancing Urban Safety and S
- Page 32 and 33:
xxx Enhancing Urban Safety and Secu
- Page 34:
xxxii Enhancing Urban Safety and Se
- Page 38 and 39:
4 Understanding Urban Safety and Se
- Page 41 and 42:
1 CHAPTER CURRENT THREATS TO URBAN
- Page 43 and 44:
Current threats to urban safety and
- Page 45 and 46:
Current threats to urban safety and
- Page 47 and 48:
Current threats to urban safety and
- Page 49 and 50:
Current threats to urban safety and
- Page 51 and 52:
Current threats to urban safety and
- Page 53 and 54:
Current threats to urban safety and
- Page 55 and 56:
Current threats to urban safety and
- Page 57 and 58:
2 CHAPTER VULNERABILITY, RISK AND R
- Page 59 and 60:
Vulnerability, risk and resilience:
- Page 61 and 62:
Vulnerability, risk and resilience:
- Page 63 and 64:
29 simply ‘give up’ in the face
- Page 65 and 66:
Vulnerability, risk and resilience:
- Page 67 and 68:
Vulnerability, risk and resilience:
- Page 69 and 70:
Vulnerability, risk and resilience:
- Page 71 and 72:
Vulnerability, risk and resilience:
- Page 73 and 74:
Vulnerability, risk and resilience:
- Page 75:
Vulnerability, risk and resilience:
- Page 80 and 81:
46 Urban crime and violence Box II.
- Page 82 and 83:
48 Urban crime and violence it has
- Page 84 and 85:
50 Urban crime and violence Formal
- Page 86 and 87:
52 Urban crime and violence Contact
- Page 88 and 89:
54 Urban crime and violence Per 100
- Page 90 and 91:
56 Urban crime and violence Burglar
- Page 92 and 93:
58 Urban crime and violence Percent
- Page 94 and 95:
60 Urban crime and violence Figure
- Page 96 and 97:
62 Urban crime and violence Table 3
- Page 98 and 99:
64 Urban crime and violence Youth g
- Page 100 and 101:
66 Urban crime and violence Table 3
- Page 102 and 103:
68 Urban crime and violence Type of
- Page 104 and 105:
70 Urban crime and violence From a
- Page 106 and 107:
72 Urban crime and violence One vio
- Page 108 and 109:
74 Urban crime and violence High ho
- Page 110 and 111:
76 Urban crime and violence Abused
- Page 112 and 113:
78 Urban crime and violence General
- Page 114 and 115:
80 Urban crime and violence Table 3
- Page 116 and 117:
82 Urban crime and violence porate
- Page 118 and 119:
4 CHAPTER URBAN CRIME AND VIOLENCE:
- Page 120 and 121:
86 Urban crime and violence UN-Habi
- Page 122 and 123:
88 Urban crime and violence Box 4.2
- Page 124 and 125:
90 Urban crime and violence Box 4.4
- Page 126 and 127:
92 Urban crime and violence Legisla
- Page 128 and 129:
94 Urban crime and violence above w
- Page 130 and 131:
96 Urban crime and violence Campaig
- Page 132 and 133:
98 Urban crime and violence Availab
- Page 134 and 135:
100 Urban crime and violence Box 4.
- Page 136 and 137:
102 Urban crime and violence In som
- Page 138 and 139:
104 Urban crime and violence Initia
- Page 140 and 141:
106 Urban crime and violence The mo
- Page 142:
108 Urban crime and violence Vander
- Page 146 and 147:
112 Security of tenure Box III.1 Se
- Page 148 and 149:
5 CHAPTER SECURITY OF TENURE: CONDI
- Page 150 and 151:
116 Security of tenure Table 5.1 A
- Page 152 and 153:
118 Security of tenure Fully legal
- Page 154 and 155:
120 Security of tenure Box 5.4 Secu
- Page 156 and 157:
122 Security of tenure Urban tenure
- Page 158 and 159:
124 Security of tenure At least 2 m
- Page 160 and 161:
126 Security of tenure Market-based
- Page 162 and 163:
128 Security of tenure Box 5.11 Urb
- Page 164 and 165:
130 Security of tenure Operation Mu
- Page 166 and 167:
132 Security of tenure Control of l
- Page 168 and 169:
134 Security of tenure Box 5.18 Sec
- Page 170 and 171:
136 Security of tenure NOTES 1 Habi
- Page 172 and 173:
138 Security of tenure Box 6.1 The
- Page 174 and 175:
140 Security of tenure It would be
- Page 176 and 177:
142 Security of tenure Box 6.7 Land
- Page 178 and 179:
144 Security of tenure Box 6.10 Wha
- Page 180 and 181:
146 Security of tenure Box 6.12 Evi
- Page 182 and 183:
148 Security of tenure Box 6.15 Con
- Page 184 and 185:
150 Security of tenure Box 6.18 Vio
- Page 186 and 187:
152 Security of tenure The
- Page 188 and 189:
154 Security of tenure Box 6.24 Lan
- Page 190 and 191:
156 Security of tenure The state is
- Page 192 and 193:
158 Security of tenure Housing righ
- Page 197 and 198:
Over the last three decades, natura
- Page 199 and 200:
Introduction 165 One of the key tre
- Page 201 and 202:
7 CHAPTER DISASTER RISK: CONDITIONS
- Page 203 and 204:
Disaster risk: Conditions, trends a
- Page 205 and 206:
Disaster risk: Conditions, trends a
- Page 207 and 208:
Disaster risk: Conditions, trends a
- Page 209 and 210:
Disaster risk: Conditions, trends a
- Page 211 and 212:
Disaster risk: Conditions, trends a
- Page 213 and 214:
Disaster risk: Conditions, trends a
- Page 215 and 216:
Disaster risk: Conditions, trends a
- Page 217 and 218:
Disaster risk: Conditions, trends a
- Page 219 and 220:
Disaster risk: Conditions, trends a
- Page 221 and 222:
Disaster risk: Conditions, trends a
- Page 223 and 224:
Disaster risk: Conditions, trends a
- Page 225 and 226:
Disaster risk: Conditions, trends a
- Page 227 and 228:
Disaster risk: Conditions, trends a
- Page 229 and 230:
8 CHAPTER POLICY RESPONSES TO DISAS
- Page 231 and 232:
Policy responses to disaster risk 1
- Page 233 and 234:
Policy responses to disaster risk 1
- Page 235 and 236:
Policy responses to disaster risk 2
- Page 237 and 238:
Policy responses to disaster risk 2
- Page 239 and 240:
Policy responses to disaster risk 2
- Page 241 and 242:
Policy responses to disaster risk 2
- Page 243 and 244:
Policy responses to disaster risk 2
- Page 245 and 246:
Policy responses to disaster risk 2
- Page 247 and 248:
Policy responses to disaster risk 2
- Page 249 and 250:
Policy responses to disaster risk 2
- Page 251:
Policy responses to disaster risk 2
- Page 254 and 255:
220 Natural and human-made disaster
- Page 256 and 257:
222 Natural and human-made disaster
- Page 258 and 259:
224 Natural and human-made disaster
- Page 260 and 261:
226 Natural and human-made disaster
- Page 262 and 263:
228 Natural and human-made disaster
- Page 264 and 265:
230 Natural and human-made disaster
- Page 266:
232 Natural and human-made disaster
- Page 270 and 271:
236 Towards safer and more secure c
- Page 272 and 273:
238 Towards safer and more secure c
- Page 274 and 275:
240 Towards safer and more secure c
- Page 276 and 277:
242 Towards safer and more secure c
- Page 278 and 279:
244 Towards safer and more secure c
- Page 280 and 281:
246 Towards safer and more secure c
- Page 282 and 283:
248 Towards safer and more secure c
- Page 284 and 285:
250 Towards safer and more secure c
- Page 286 and 287:
252 Towards safer and more secure c
- Page 288 and 289:
254 Towards safer and more secure c
- Page 290 and 291:
256 Towards safer and more secure c
- Page 292 and 293:
258 Towards safer and more secure c
- Page 294 and 295:
260 Towards safer and more secure c
- Page 296 and 297:
11 CHAPTER ENHANCING TENURE SECURIT
- Page 298 and 299:
264 Towards safer and more secure c
- Page 300 and 301:
266 Towards safer and more secure c
- Page 302 and 303:
268 Towards safer and more secure c
- Page 304 and 305:
270 Towards safer and more secure c
- Page 306 and 307:
272 Towards safer and more secure c
- Page 308 and 309:
274 Towards safer and more secure c
- Page 310 and 311:
276 Enhancing Urban Safety and Secu
- Page 312 and 313:
12 CHAPTER MITIGATING THE IMPACTS O
- Page 314 and 315:
280 Towards safer and more secure c
- Page 316 and 317:
282 Towards safer and more secure c
- Page 318 and 319:
284 Towards safer and more secure c
- Page 320 and 321:
286 Towards safer and more secure c
- Page 322 and 323:
288 Towards safer and more secure c
- Page 324 and 325: 290 Towards safer and more secure c
- Page 326 and 327: 292 Towards safer and more secure c
- Page 328 and 329: 294 Towards safer and more secure c
- Page 330 and 331: 296 Towards safer and more secure c
- Page 332 and 333: 298 Towards safer and more secure c
- Page 334: 300 Towards safer and more secure c
- Page 338 and 339: 304 Summary of case studies Since i
- Page 340 and 341: 306 Summary of case studies • The
- Page 342 and 343: 308 Summary of case studies tions w
- Page 344 and 345: 310 Summary of case studies environ
- Page 346 and 347: 312 Summary of case studies others.
- Page 348 and 349: 314 Summary of case studies purpose
- Page 350 and 351: 316 Summary of case studies These e
- Page 352 and 353: 318 Summary of case studies develop
- Page 354 and 355: 320 Summary of case studies tion ex
- Page 356 and 357: 322 Summary of case studies Housing
- Page 358 and 359: 324 Summary of case studies Prolong
- Page 360: 326 Summary of case studies momentu
- Page 364 and 365: 330 Statistical annex Islands, Micr
- Page 366 and 367: 332 Statistical annex NOMENCLATURE
- Page 368 and 369: 334 Statistical annex Population, u
- Page 370 and 371: 336 Statistical annex SOURCES OF DA
- Page 372 and 373: 338 Enhancing Urban Safety and Secu
- Page 376 and 377: 342 Enhancing Urban Safety and Secu
- Page 378 and 379: 344 Enhancing Urban Safety and Secu
- Page 380 and 381: 346 Enhancing Urban Safety and Secu
- Page 382 and 383: 348 Enhancing Urban Safety and Secu
- Page 384 and 385: 350 Enhancing Urban Safety and Secu
- Page 386 and 387: 352 Enhancing Urban Safety and Secu
- Page 388 and 389: 354 Enhancing Urban Safety and Secu
- Page 390 and 391: 356 Enhancing Urban Safety and Secu
- Page 392 and 393: 358 Enhancing Urban Safety and Secu
- Page 394 and 395: 360 Enhancing Urban Safety and Secu
- Page 396 and 397: 362 Enhancing Urban Safety and Secu
- Page 398 and 399: 364 Enhancing Urban Safety and Secu
- Page 400 and 401: 366 Enhancing Urban Safety and Secu
- Page 402 and 403: 368 Enhancing Urban Safety and Secu
- Page 404 and 405: 370 Enhancing Urban Safety and Secu
- Page 406 and 407: 372 Enhancing Urban Safety and Secu
- Page 408 and 409: 374 Enhancing Urban Safety and Secu
- Page 410 and 411: 376 Enhancing Urban Safety and Secu
- Page 412 and 413: 378 Enhancing Urban Safety and Secu
- Page 414 and 415: 380 Enhancing Urban Safety and Secu
- Page 416 and 417: 382 Enhancing Urban Safety and Secu
- Page 418 and 419: 384 Enhancing Urban Safety and Secu
- Page 420 and 421: 386 Enhancing Urban Safety and Secu
- Page 422 and 423: 388 Enhancing Urban Safety and Secu
- Page 424 and 425:
390 Enhancing Urban Safety and Secu
- Page 426 and 427:
392 Enhancing Urban Safety and Secu
- Page 428 and 429:
394 Enhancing Urban Safety and Secu
- Page 430 and 431:
396 Enhancing Urban Safety and Secu
- Page 432 and 433:
398 Enhancing Urban Safety and Secu
- Page 434 and 435:
400 Enhancing Urban Safety and Secu
- Page 436 and 437:
402 Enhancing Urban Safety and Secu
- Page 438 and 439:
404 Enhancing Urban Safety and Secu
- Page 440 and 441:
406 Enhancing Urban Safety and Secu
- Page 442 and 443:
408 Enhancing Urban Safety and Secu
- Page 444 and 445:
410 TABLE C.7 continued Enhancing U
- Page 446 and 447:
412 Enhancing Urban Safety and Secu
- Page 448 and 449:
414 Enhancing Urban Safety and Secu
- Page 450 and 451:
416 Enhancing Urban Safety and Secu
- Page 452 and 453:
418 Enhancing Urban Safety and Secu
- Page 454 and 455:
420 Enhancing Urban Safety and Secu
- Page 456 and 457:
422 Enhancing Urban Safety and Secu
- Page 458 and 459:
424 Enhancing Urban Safety and Secu
- Page 460 and 461:
426 Enhancing Urban Safety and Secu
- Page 462 and 463:
428 Enhancing Urban Safety and Secu
- Page 464 and 465:
430 Enhancing Urban Safety and Secu
- Page 467 and 468:
INDEX ACHR (Asian Coalition for Hou
- Page 469 and 470:
Index 435 security of tenure 134 co
- Page 471 and 472:
Index 437 domestic abuse see intima
- Page 473 and 474:
Index 439 hazard management 169 haz
- Page 475 and 476:
Index 441 Kosovo, security of tenur
- Page 477 and 478:
Index 443 participation 38, 296-299
- Page 479 and 480:
Index 445 individual 34-35 municipa
- Page 481 and 482:
Index 447 gun ownership 78 Homeless