Global Report on Human Settlements 2007 - PoA-ISS
Global Report on Human Settlements 2007 - PoA-ISS
Global Report on Human Settlements 2007 - PoA-ISS

You also want an ePaper? Increase the reach of your titles
YUMPU automatically turns print PDFs into web optimized ePapers that Google loves.
Data tables<br />
341<br />
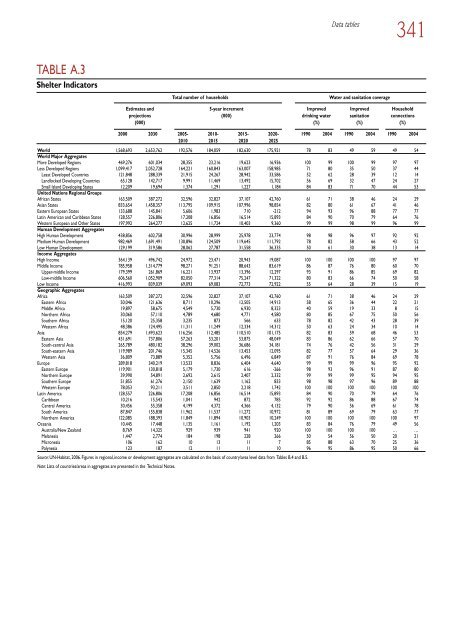
TABLE A.3<br />
Shelter Indicators<br />
Total number of households<br />
Water and sanitati<strong>on</strong> coverage<br />
World 1,568,693 2,653,762 192,576 184,059 182,630 175,921 78 83 49 59 49 54<br />
World Major Aggregates<br />
More Developed Regi<strong>on</strong>s 469,276 601,034 28,355 23,216 19,623 16,936 100 99 100 99 97 97<br />
Less Developed Regi<strong>on</strong>s 1,099,417 2,052,728 164,221 160,843 163,007 158,985 71 80 35 50 37 44<br />
Least Developed Countries 121,848 288,339 21,915 24,267 28,942 33,586 52 62 28 39 12 14<br />
Landlocked Developing Countries 65,128 142,717 9,991 11,469 13,492 15,702 56 69 32 47 24 27<br />
Small Island Developing States 12,209 19,694 1,374 1,291 1,227 1,184 84 83 71 70 44 53<br />
United Nati<strong>on</strong>s Regi<strong>on</strong>al Groups<br />
African States 163,509 387,272 32,596 32,827 37,107 42,760 61 71 38 46 24 29<br />
Asian States 833,654 1,458,357 113,795 109,915 107,996 98,854 82 80 61 67 41 46<br />
Eastern European States 133,688 145,841 5,606 1,983 710 -212 94 93 96 88 77 77<br />
Latin American and Caribbean States 128,557 226,806 17,208 16,856 16,514 15,893 84 90 70 79 64 76<br />
Western European and Other States 197,992 264,277 12,625 11,724 10,403 9,360 99 99 98 99 96 99<br />
<strong>Human</strong> Development Aggregates<br />
High <strong>Human</strong> Development 438,856 602,758 30,996 28,999 25,978 23,774 98 98 96 97 92 92<br />
Medium <strong>Human</strong> Development 982,469 1,691,491 130,896 124,509 119,645 111,792 78 82 58 66 43 52<br />
Low <strong>Human</strong> Development 129,199 319,586 28,062 27,787 31,558 36,335 50 61 30 38 13 14<br />
Income Aggregates<br />
High Income 364,139 496,742 24,972 23,471 20,943 19,087 100 100 100 100 97 97<br />
Middle Income 785,958 1,314,779 98,271 91,251 88,643 83,619 86 87 76 80 60 70<br />
Upper-middle Income 179,399 261,869 16,221 13,937 13,396 12,297 93 91 86 85 69 82<br />
Low-middle Income 606,560 1,052,909 82,050 77,314 75,247 71,322 80 83 66 74 50 58<br />
Low Income 416,993 839,039 69,093 69,083 72,773 72,922 55 64 28 39 15 19<br />
Geographic Aggregates<br />
Africa 163,509 387,272 32,596 32,827 37,107 42,760 61 71 38 46 24 29<br />
Eastern Africa 50,046 121,636 8,711 10,296 12,505 14,913 58 65 36 44 22 21<br />
Middle Africa 19,897 58,675 4,549 5,730 6,930 8,323 40 59 19 33 8 15<br />
Northern Africa 30,060 57,110 4,789 4,680 4,771 4,580 80 85 67 75 50 56<br />
Southern Africa 15,120 25,358 3,235 873 566 633 78 82 42 43 28 39<br />
Western Africa 48,386 124,495 11,311 11,249 12,334 14,312 50 63 24 34 10 14<br />
Asia 854,279 1,493,623 116,256 112,485 110,510 101,175 82 83 59 68 46 53<br />
Eastern Asia 431,691 737,806 57,263 53,201 53,875 48,049 83 86 62 66 57 70<br />
South-central Asia 265,789 480,182 38,296 39,002 36,686 34,181 74 76 42 56 31 29<br />
South-eastern Asia 119,989 201,746 15,345 14,526 13,453 12,095 82 77 57 64 29 36<br />
Western Asia 36,809 73,889 5,352 5,756 6,496 6,849 87 91 76 84 69 78<br />
Europe 289,818 340,219 13,533 8,836 6,404 4,640 99 99 99 96 95 92<br />
Eastern Europe 119,901 130,818 5,179 1,730 616 -266 98 93 96 91 87 80<br />
Northern Europe 39,990 54,891 2,692 2,615 2,407 2,332 99 99 99 95 94 95<br />
Southern Europe 51,855 61,276 2,150 1,639 1,162 833 98 98 97 96 89 88<br />
Western Europe 78,053 93,211 3,511 2,850 2,218 1,742 100 100 100 100 100 100<br />
Latin America 128,557 226,806 17,208 16,856 16,514 15,893 84 90 70 79 64 76<br />
Caribbean 10,216 15,543 1,041 942 872 785 92 92 86 88 67 74<br />
Central America 30,456 55,358 4,199 4,372 4,366 4,132 79 90 56 69 61 78<br />
South America 87,847 155,838 11,962 11,537 11,272 10,972 81 89 69 79 63 77<br />
Northern America 122,085 188,393 11,849 11,894 10,903 10,249 100 100 100 100 100 97<br />
Oceania 10,445 17,448 1,135 1,161 1,192 1,203 83 84 76 79 49 56<br />
Australia/New Zealand 8,769 14,325 929 939 941 920 100 100 100 100 … …<br />
Melanesia 1,447 2,774 184 198 228 266 50 54 56 50 20 21<br />
Micr<strong>on</strong>esia 106 162 10 13 11 7 85 88 63 70 25 36<br />
Polynesia 123 187 12 11 11 10 96 95 86 95 50 66<br />
Source: UN-Habitat, 2006. Figures in regi<strong>on</strong>al, income or development aggregates are calculated <strong>on</strong> the basis of country/area level data from Tables B.4 and B.5.<br />
Note: Lists of countries/areas in aggregates are presented in the Technical Notes.<br />
Estimates and 5-year increment Improved Improved Household<br />
projecti<strong>on</strong>s (000) drinking water sanitati<strong>on</strong> c<strong>on</strong>necti<strong>on</strong>s<br />
(000) (%) (%) (%)<br />
2000 2030 2005- 2010- 2015- 2020- 1990 2004 1990 2004 1990 2004<br />
2010 2015 2020 2025