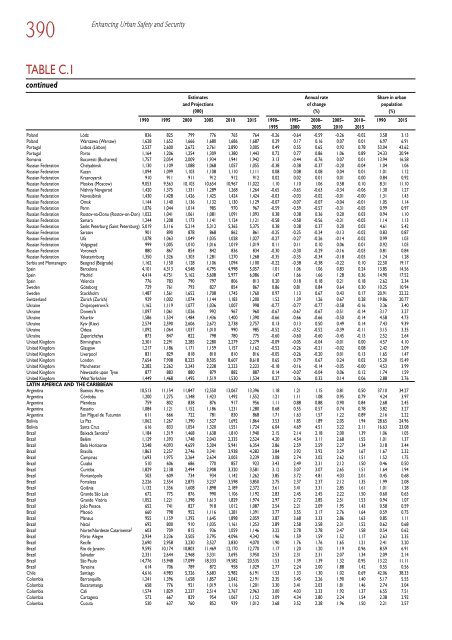
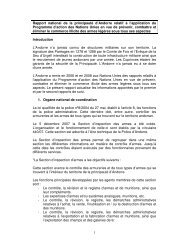
390 Enhancing Urban Safety and Security TABLE C.1 c<strong>on</strong>tinued Estimates Annual rate Share in urban and Projecti<strong>on</strong>s of change populati<strong>on</strong> (000) (%) (%) 1990 1995 2000 2005 2010 2015 1990– 1995– 2000– 2005– 2010– 1990 2015 1995 2000 2005 2010 2015 Poland Lódz 836 825 799 776 765 764 -0.26 -0.64 -0.59 -0.26 -0.02 3.58 3.13 Poland Warszawa (Warsaw) 1,628 1,652 1,666 1,680 1,686 1,687 0.29 0.17 0.16 0.07 0.01 6.97 6.91 Portugal Lisboa (Lisb<strong>on</strong>) 2,537 2,600 2,672 2,761 2,890 3,005 0.49 0.55 0.65 0.92 0.78 53.04 43.62 Portugal Porto 1,164 1,206 1,254 1,309 1,380 1,443 0.72 0.77 0.86 1.06 0.89 24.33 20.94 Romania Bucuresti (Bucharest) 1,757 2,054 2,009 1,934 1,941 1,942 3.13 -0.44 -0.76 0.07 0.01 13.94 16.58 Russian Federati<strong>on</strong> Chelyabinsk 1,130 1,109 1,088 1,068 1,057 1,055 -0.38 -0.38 -0.37 -0.20 -0.04 1.04 1.06 Russian Federati<strong>on</strong> Kazan 1,094 1,099 1,103 1,108 1,110 1,111 0.08 0.08 0.08 0.04 0.01 1.01 1.12 Russian Federati<strong>on</strong> Krasnoyarsk 910 911 911 912 912 912 0.02 0.02 0.01 0.01 0.00 0.84 0.92 Russian Federati<strong>on</strong> Moskva (Moscow) 9,053 9,563 10,103 10,654 10,967 11,022 1.10 1.10 1.06 0.58 0.10 8.31 11.10 Russian Federati<strong>on</strong> Nizhniy Novgorod 1,420 1,375 1,331 1,289 1,268 1,264 -0.65 -0.65 -0.63 -0.34 -0.06 1.30 1.27 Russian Federati<strong>on</strong> Novosibirsk 1,430 1,428 1,426 1,425 1,424 1,424 -0.03 -0.03 -0.02 -0.01 -0.00 1.31 1.43 Russian Federati<strong>on</strong> Omsk 1,144 1,140 1,136 1,132 1,130 1,129 -0.07 -0.07 -0.07 -0.04 -0.01 1.05 1.14 Russian Federati<strong>on</strong> Perm 1,076 1,044 1,014 985 970 967 -0.59 -0.59 -0.57 -0.31 -0.05 0.99 0.97 Russian Federati<strong>on</strong> Rostov-na-D<strong>on</strong>u (Rostov-<strong>on</strong>-D<strong>on</strong>) 1,022 1,041 1,061 1,081 1,091 1,093 0.38 0.38 0.36 0.20 0.03 0.94 1.10 Russian Federati<strong>on</strong> Samara 1,244 1,208 1,173 1,141 1,124 1,121 -0.58 -0.58 -0.56 -0.31 -0.05 1.14 1.13 Russian Federati<strong>on</strong> Sankt Peterburg (Saint Petersburg) 5,019 5,116 5,214 5,312 5,365 5,375 0.38 0.38 0.37 0.20 0.03 4.61 5.42 Russian Federati<strong>on</strong> Saratov 901 890 878 868 862 861 -0.25 -0.25 -0.24 -0.13 -0.02 0.83 0.87 Russian Federati<strong>on</strong> Ufa 1,078 1,063 1,049 1,035 1,028 1,027 -0.27 -0.27 -0.26 -0.14 -0.02 0.99 1.03 Russian Federati<strong>on</strong> Volgograd 999 1,005 1,010 1,016 1,019 1,019 0.11 0.11 0.10 0.06 0.01 0.92 1.03 Russian Federati<strong>on</strong> Vor<strong>on</strong>ezh 880 867 854 842 836 834 -0.30 -0.30 -0.29 -0.16 -0.03 0.81 0.84 Russian Federati<strong>on</strong> Yekaterinburg 1,350 1,326 1,303 1,281 1,270 1,268 -0.35 -0.35 -0.34 -0.18 -0.03 1.24 1.28 Serbia and M<strong>on</strong>tenegro Beograd (Belgrade) 1,162 1,150 1,128 1,106 1,094 1,100 -0.22 -0.38 -0.38 -0.22 0.10 22.50 19.17 Spain Barcel<strong>on</strong>a 4,101 4,313 4,548 4,795 4,998 5,057 1.01 1.06 1.06 0.83 0.24 13.85 14.56 Spain Madrid 4,414 4,751 5,162 5,608 5,977 6,086 1.47 1.66 1.66 1.28 0.36 14.90 17.52 Spain Valencia 776 783 790 797 806 813 0.20 0.18 0.18 0.21 0.18 2.62 2.34 Sweden Göteborg 729 761 793 827 854 867 0.86 0.81 0.84 0.64 0.30 10.25 10.94 Sweden Stockholm 1,487 1,561 1,652 1,708 1,745 1,760 0.97 1.13 0.67 0.43 0.17 20.91 22.22 Switzerland Zürich (Zurich) 929 1,002 1,074 1,144 1,183 1,200 1.52 1.39 1.26 0.67 0.28 19.86 20.77 Ukraine Dnipropetrovs’k 1,162 1,119 1,077 1,036 1,007 998 -0.77 -0.77 -0.77 -0.58 -0.16 3.36 3.40 Ukraine D<strong>on</strong>ets’k 1,097 1,061 1,026 992 967 960 -0.67 -0.67 -0.67 -0.51 -0.14 3.17 3.27 Ukraine Kharkiv 1,586 1,534 1,484 1,436 1,400 1,390 -0.66 -0.66 -0.66 -0.50 -0.14 4.58 4.73 Ukraine Kyiv (Kiev) 2,574 2,590 2,606 2,672 2,738 2,757 0.13 0.13 0.50 0.49 0.14 7.43 9.39 Ukraine Odesa 1,092 1,064 1,037 1,010 990 985 -0.52 -0.52 -0.52 -0.39 -0.11 3.15 3.35 Ukraine Zaporizhzhya 873 847 822 798 780 775 -0.60 -0.60 -0.60 -0.45 -0.13 2.52 2.64 United Kingdom Birmingham 2,301 2,291 2,285 2,280 2,279 2,279 -0.09 -0.05 -0.04 -0.01 0.00 4.57 4.10 United Kingdom Glasgow 1,217 1,186 1,171 1,159 1,157 1,162 -0.52 -0.26 -0.21 -0.02 0.08 2.42 2.09 United Kingdom Liverpool 831 829 818 810 810 816 -0.05 -0.26 -0.20 0.01 0.13 1.65 1.47 United Kingdom L<strong>on</strong>d<strong>on</strong> 7,654 7,908 8,225 8,505 8,607 8,618 0.65 0.79 0.67 0.24 0.02 15.20 15.49 United Kingdom Manchester 2,282 2,262 2,243 2,228 2,223 2,223 -0.18 -0.16 -0.14 -0.05 -0.00 4.53 3.99 United Kingdom Newcastle up<strong>on</strong> Tyne 877 883 880 879 882 887 0.14 -0.07 -0.04 0.06 0.12 1.74 1.59 United Kingdom West Yorkshire 1,449 1,468 1,495 1,519 1,530 1,534 0.27 0.36 0.32 0.14 0.06 2.88 2.76 LATIN AMERICA AND THE CARIBBEAN Argentina Buenos Aires 10,513 11,154 11,847 12,550 13,067 13,396 1.18 1.21 1.15 0.81 0.50 37.10 34.27 Argentina Córdoba 1,200 1,275 1,348 1,423 1,492 1,552 1.21 1.11 1.08 0.95 0.79 4.24 3.97 Argentina Mendoza 759 802 838 876 917 956 1.11 0.88 0.88 0.90 0.84 2.68 2.45 Argentina Rosario 1,084 1,121 1,152 1,186 1,231 1,280 0.68 0.55 0.57 0.74 0.78 3.82 3.27 Argentina San Miguel de Tucumán 611 666 722 781 830 868 1.71 1.63 1.57 1.22 0.89 2.16 2.22 Bolivia La Paz 1,062 1,267 1,390 1,527 1,692 1,864 3.53 1.85 1.89 2.05 1.94 28.65 24.96 Bolivia Santa Cruz 616 833 1,054 1,320 1,551 1,724 6.04 4.69 4.51 3.22 2.11 16.63 23.08 Brazil Baixada Santista 2 1,184 1,319 1,468 1,638 1,810 1,940 2.15 2.14 2.18 2.00 1.39 1.06 1.05 Brazil Belém 1,129 1,393 1,748 2,043 2,335 2,524 4.20 4.54 3.11 2.68 1.55 1.01 1.37 Brazil Belo Horiz<strong>on</strong>te 3,548 4,093 4,659 5,304 5,941 6,354 2.86 2.59 2.59 2.27 1.34 3.18 3.44 Brazil Brasília 1,863 2,257 2,746 3,341 3,938 4,282 3.84 3.92 3.92 3.29 1.67 1.67 2.32 Brazil Campinas 1,693 1,975 2,264 2,634 3,003 3,239 3.08 2.74 3.02 2.62 1.51 1.52 1.75 Brazil Cuiabá 510 606 686 770 857 923 3.43 2.49 2.31 2.12 1.50 0.46 0.50 Brazil Curitiba 1,829 2,138 2,494 2,908 3,320 3,581 3.12 3.07 3.07 2.65 1.51 1.64 1.94 Brazil Florianópolis 503 609 734 934 1,142 1,262 3.85 3.72 4.81 4.03 2.01 0.45 0.68 Brazil Fortaleza 2,226 2,554 2,875 3,237 3,598 3,850 2.75 2.37 2.37 2.12 1.35 1.99 2.08 Brazil Goiânia 1,132 1,356 1,608 1,898 2,189 2,372 3.61 3.41 3.31 2.85 1.61 1.01 1.28 Brazil Grande São Luís 672 775 876 990 1,106 1,192 2.83 2.45 2.45 2.22 1.50 0.60 0.65 Brazil Grande Vitória 1,052 1,221 1,398 1,613 1,829 1,974 2.97 2.72 2.85 2.51 1.53 0.94 1.07 Brazil João Pessoa 652 741 827 918 1,012 1,087 2.54 2.21 2.09 1.95 1.43 0.58 0.59 Brazil Maceió 660 798 952 1,116 1,281 1,391 3.77 3.55 3.17 2.76 1.64 0.59 0.75 Brazil Manaus 955 1,159 1,392 1,645 1,898 2,059 3.87 3.68 3.33 2.86 1.63 0.85 1.11 Brazil Natal 692 800 910 1,035 1,161 1,253 2.89 2.58 2.58 2.31 1.52 0.62 0.68 Brazil Norte/Nordeste Catarinense 3 603 709 815 936 1,059 1,146 3.22 2.78 2.78 2.47 1.58 0.54 0.62 Brazil Pôrto Alegre 2,934 3,236 3,505 3,795 4,096 4,342 1.96 1.59 1.59 1.52 1.17 2.63 2.35 Brazil Recife 2,690 2,958 3,230 3,527 3,830 4,070 1.90 1.76 1.76 1.65 1.21 2.41 2.20 Brazil Rio de Janeiro 9,595 10,174 10,803 11,469 12,170 12,770 1.17 1.20 1.20 1.19 0.96 8.59 6.91 Brazil Salvador 2,331 2,644 2,968 3,331 3,695 3,950 2.53 2.31 2.31 2.07 1.34 2.09 2.14 Brazil São Paulo 14,776 15,948 17,099 18,333 19,582 20,535 1.53 1.39 1.39 1.32 0.95 13.22 11.11 Brazil Teresina 614 706 789 872 958 1,029 2.77 2.24 2.00 1.88 1.42 0.55 0.56 Chile Santiago 4,616 4,983 5,326 5,683 5,982 6,191 1.53 1.33 1.30 1.02 0.69 42.06 38.33 Colombia Barranquilla 1,241 1,396 1,658 1,857 2,042 2,191 2.35 3.45 2.26 1.90 1.40 5.17 5.55 Colombia Bucaramanga 658 776 921 1,019 1,116 1,201 3.30 3.41 2.03 1.81 1.46 2.74 3.04 Colombia Cali 1,574 1,829 2,237 2,514 2,767 2,963 3.00 4.03 2.33 1.92 1.37 6.55 7.51 Colombia Cartagena 572 667 829 954 1,067 1,152 3.09 4.34 2.80 2.24 1.54 2.38 2.92 Colombia Cucuta 530 637 760 852 939 1,012 3.68 3.52 2.28 1.96 1.50 2.21 2.57
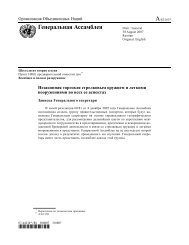
Data tables 391 TABLE C.1 c<strong>on</strong>tinued Estimates Annual rate Share in urban and Projecti<strong>on</strong>s of change populati<strong>on</strong> (000) (%) (%) 1990 1995 2000 2005 2010 2015 1990– 1995– 2000– 2005– 2010– 1990 2015 1995 2000 2005 2010 2015 Colombia Medellín 2,155 2,403 2,814 3,058 3,304 3,522 2.18 3.16 1.67 1.54 1.28 8.97 8.93 Colombia Santa Fé de Bogotá 4,905 5,751 6,964 7,747 8,416 8,932 3.18 3.83 2.13 1.66 1.19 20.42 22.65 Costa Rica San José 737 867 1,032 1,217 1,374 1,506 3.25 3.48 3.29 2.43 1.84 47.30 45.22 Cuba La Habana (Havana) 2,108 2,183 2,187 2,189 2,159 2,151 0.69 0.04 0.02 -0.27 -0.08 27.28 25.19 Dominican Republic Santo Domingo 1,522 1,665 1,834 2,022 2,240 2,449 1.80 1.93 1.96 2.04 1.78 38.88 32.87 Ecuador Guayaquil 1,572 1,808 2,077 2,387 2,709 2,975 2.80 2.78 2.78 2.53 1.87 27.77 29.07 Ecuador Quito 1,088 1,217 1,357 1,514 1,680 1,839 2.25 2.18 2.18 2.09 1.80 19.22 17.96 El Salvador San Salvador 970 1,142 1,353 1,517 1,662 1,807 3.27 3.39 2.29 1.83 1.67 38.54 35.69 Guatemala Ciudad de Guatemala (Guatemala City)803 839 908 984 1,103 1,269 0.89 1.57 1.62 2.28 2.81 21.95 15.39 Haiti Port-au-Prince 1,134 1,427 1,766 2,129 2,460 2,785 4.60 4.26 3.74 2.89 2.48 56.05 62.81 H<strong>on</strong>duras Tegucigalpa 578 677 793 927 1,075 1,230 3.16 3.16 3.14 2.96 2.68 29.48 27.22 Mexico Acapulco de Juárez 598 681 726 769 816 864 2.61 1.27 1.17 1.18 1.14 0.98 0.92 Mexico Aguascalientes 552 631 736 859 981 1,059 2.69 3.07 3.10 2.64 1.53 0.90 1.13 Mexico Ciudad de México (Mexico City) 15,311 16,790 18,066 19,411 20,688 21,568 1.84 1.47 1.44 1.27 0.83 25.07 23.01 Mexico Ciudad Juárez 809 997 1,239 1,540 1,841 2,008 4.19 4.34 4.35 3.57 1.73 1.32 2.14 Mexico Culiacán 606 690 750 812 876 931 2.60 1.67 1.60 1.51 1.23 0.99 0.99 Mexico Guadalajara 3,011 3,431 3,697 3,968 4,237 4,456 2.61 1.50 1.41 1.31 1.01 4.93 4.75 Mexico León de los Aldamas 961 1,127 1,293 1,481 1,665 1,785 3.19 2.75 2.72 2.33 1.39 1.57 1.90 Mexico Mérida 664 765 849 939 1,028 1,097 2.83 2.07 2.01 1.82 1.30 1.09 1.17 Mexico Mexicali 607 690 771 860 949 1,015 2.57 2.22 2.20 1.96 1.35 0.99 1.08 Mexico M<strong>on</strong>terrey 2,594 2,961 3,267 3,596 3,914 4,140 2.65 1.97 1.92 1.70 1.13 4.25 4.42 Mexico Puebla 1,699 1,932 1,888 1,824 1,801 1,861 2.57 -0.46 -0.69 -0.25 0.65 2.78 1.99 Mexico Querétaro 561 671 798 947 1,094 1,185 3.58 3.45 3.43 2.89 1.60 0.92 1.26 Mexico San Luis Potosí 665 774 857 946 1,034 1,103 3.04 2.05 1.97 1.79 1.29 1.09 1.18 Mexico Tijuana 760 1,017 1,297 1,649 2,003 2,194 5.82 4.86 4.79 3.90 1.82 1.25 2.34 Mexico Toluca de Lerdo 835 981 1,420 1,545 1,669 1,770 3.22 7.39 1.69 1.55 1.17 1.37 1.89 Mexico Torreón 882 954 1,012 1,072 1,136 1,200 1.55 1.18 1.15 1.16 1.10 1.45 1.28 Mexico Tuxtla Gutierrez 294 372 539 788 1,067 1,209 4.72 7.41 7.61 6.06 2.49 0.48 1.29 Nicaragua Managua 735 870 1,021 1,165 1,312 1,461 3.37 3.21 2.64 2.36 2.15 34.97 34.94 Panama Ciudad de Panamá (Panama City) 847 953 1,072 1,216 1,379 1,527 2.36 2.36 2.51 2.52 2.04 65.24 51.93 Paraguay Asunción 928 1,140 1,457 1,858 2,264 2,606 4.12 4.92 4.86 3.95 2.81 45.16 53.20 Peru Arequipa 564 640 724 819 915 994 2.54 2.46 2.46 2.22 1.65 3.76 4.12 Peru Lima 5,825 6,456 6,811 7,186 7,590 8,026 2.06 1.07 1.07 1.10 1.12 38.87 33.29 Puerto Rico San Juan 1,539 1,855 2,237 2,605 2,758 2,791 3.74 3.74 3.04 1.15 0.23 60.44 67.65 Uruguay M<strong>on</strong>tevideo 1,274 1,299 1,285 1,264 1,260 1,277 0.38 -0.21 -0.33 -0.06 0.27 46.12 37.34 Venezuela Barquisimeto 742 828 923 1,029 1,143 1,243 2.18 2.18 2.18 2.10 1.67 4.48 4.14 Venezuela Caracas 2,767 2,816 2,864 2,913 2,988 3,144 0.35 0.34 0.34 0.51 1.02 16.70 10.47 Venezuela Maracaibo 1,351 1,603 1,901 2,255 2,639 2,911 3.41 3.42 3.41 3.14 1.97 8.15 9.69 Venezuela Maracay 766 881 1,015 1,168 1,333 1,463 2.82 2.82 2.82 2.65 1.85 4.62 4.87 Venezuela Valencia 1,129 1,462 1,893 2,451 3,090 3,499 5.17 5.17 5.16 4.64 2.48 6.81 11.65 NORTHERN AMERICA Canada Calgary 738 809 953 1,058 1,142 1,193 1.84 3.26 2.09 1.55 0.87 3.48 4.18 Canada Edm<strong>on</strong>t<strong>on</strong> 831 859 947 1,015 1,075 1,118 0.67 1.95 1.39 1.14 0.79 3.92 3.92 Canada M<strong>on</strong>tréal 3,154 3,305 3,471 3,640 3,787 3,897 0.94 0.98 0.95 0.79 0.57 14.87 13.65 Canada Ottawa-Gatineau 918 988 1,079 1,156 1,216 1,262 1.48 1.74 1.39 1.01 0.75 4.33 4.42 Canada Tor<strong>on</strong>to 3,807 4,197 4,747 5,312 5,737 5,938 1.95 2.46 2.25 1.54 0.69 17.95 20.80 Canada Vancouver 1,559 1,789 2,040 2,188 2,309 2,389 2.75 2.63 1.40 1.07 0.69 7.35 8.37 United States of America Atlanta 2,184 2,781 3,542 4,304 4,682 4,864 4.84 4.84 3.89 1.69 0.76 1.14 1.79 United States of America Austin 569 720 913 1,107 1,212 1,271 4.73 4.73 3.86 1.82 0.95 0.30 0.47 United States of America Baltimore 1,849 1,962 2,083 2,205 2,316 2,410 1.19 1.19 1.14 0.98 0.80 0.96 0.88 United States of America Bost<strong>on</strong> 3,428 3,726 4,049 4,361 4,585 4,751 1.66 1.66 1.48 1.00 0.71 1.78 1.74 United States of America Bridgeport-Stamford 714 799 894 987 1,053 1,103 2.25 2.25 1.98 1.30 0.93 0.37 0.41 United States of America Buffalo 955 966 977 999 1,043 1,091 0.23 0.23 0.44 0.86 0.90 0.50 0.40 United States of America Charlotte 461 596 769 946 1,041 1,093 5.10 5.10 4.15 1.92 0.98 0.24 0.40 United States of America Chicago 7,374 7,839 8,333 8,814 9,186 9,469 1.22 1.22 1.12 0.83 0.61 3.83 3.48 United States of America Cincinnati 1,335 1,419 1,508 1,599 1,683 1,755 1.22 1.22 1.18 1.02 0.85 0.69 0.64 United States of America Cleveland 1,680 1,734 1,789 1,855 1,939 2,019 0.63 0.63 0.72 0.88 0.82 0.87 0.74 United States of America Columbus, Ohio 950 1,040 1,138 1,236 1,310 1,370 1.81 1.81 1.64 1.18 0.89 0.49 0.50 United States of America Dallas-Fort Worth 3,219 3,665 4,172 4,655 4,941 5,121 2.59 2.59 2.19 1.20 0.72 1.67 1.88 United States of America Dayt<strong>on</strong> 616 659 706 754 798 837 1.37 1.37 1.32 1.14 0.95 0.32 0.31 United States of America Denver-Aurora 1,528 1,747 1,998 2,239 2,389 2,489 2.68 2.68 2.28 1.30 0.82 0.79 0.91 United States of America Detroit 3,703 3,804 3,909 4,034 4,192 4,342 0.54 0.54 0.63 0.77 0.71 1.92 1.59 United States of America Hartford 783 818 853 894 940 984 0.86 0.86 0.92 1.01 0.92 0.41 0.36 United States of America H<strong>on</strong>olulu 635 676 720 767 810 850 1.27 1.27 1.24 1.11 0.95 0.33 0.31 United States of America Houst<strong>on</strong> 2,922 3,353 3,849 4,320 4,596 4,767 2.76 2.76 2.31 1.24 0.73 1.52 1.75 United States of America Indianapolis 921 1,063 1,228 1,387 1,487 1,554 2.87 2.87 2.44 1.39 0.89 0.48 0.57 United States of America Jacks<strong>on</strong>ville, Florida 742 811 886 961 1,020 1,069 1.78 1.78 1.62 1.20 0.93 0.39 0.39 United States of America Kansas City 1,233 1,297 1,365 1,437 1,510 1,576 1.02 1.02 1.03 0.99 0.86 0.64 0.58 United States of America Las Vegas 708 973 1,335 1,720 1,912 2,001 6.34 6.34 5.07 2.11 0.91 0.37 0.73 United States of America Los Angeles-L<strong>on</strong>g Beach-Santa Ana10,883 11,339 11,814 12,298 12,738 13,095 0.82 0.82 0.80 0.70 0.55 5.66 4.81 United States of America Louisville 757 810 866 924 977 1,023 1.34 1.34 1.29 1.11 0.92 0.39 0.38 United States of America Memphis 829 899 976 1,053 1,115 1,167 1.64 1.64 1.51 1.16 0.91 0.43 0.43 United States of America Miami 3,969 4,431 4,946 5,434 5,739 5,940 2.20 2.20 1.88 1.09 0.69 2.06 2.18 United States of America Milwaukee 1,228 1,269 1,311 1,361 1,425 1,488 0.65 0.65 0.75 0.92 0.86 0.64 0.55 United States of America Minneapolis-St. Paul 2,087 2,236 2,397 2,556 2,688 2,795 1.38 1.39 1.29 1.00 0.78 1.09 1.03 United States of America Nashville-Davids<strong>on</strong> 577 660 755 848 909 954 2.69 2.69 2.32 1.41 0.96 0.30 0.35 United States of America New Orleans 1,039 1,024 1,009 1,010 1,049 1,096 -0.30 -0.30 0.04 0.74 0.89 0.54 0.40 United States of America New York-Newark 16,086 16,943 17,846 18,718 19,388 19,876 1.04 1.04 0.95 0.70 0.50 8.36 7.29
- Page 3:
ENHANCING URBAN SAFETY AND SECURITY
- Page 6 and 7:
First published by Earthscan in the
- Page 8 and 9:
INTRODUCTION Enhancing Urban Safety
- Page 10 and 11:
ACKNOWLEDGEMENTS The preparation of
- Page 12 and 13:
x Enhancing Urban Safety and Securi
- Page 14 and 15:
xii Enhancing Urban Safety and Secu
- Page 16 and 17:
xiv Enhancing Urban Safety and Secu
- Page 18 and 19:
xvi Enhancing Urban Safety and Secu
- Page 20 and 21:
xviii Enhancing Urban Safety and Se
- Page 22 and 23:
LIST OF FIGURES, BOXES AND TABLES F
- Page 24 and 25:
xxii Enhancing Urban Safety and Sec
- Page 26 and 27:
xxiv Enhancing Urban Safety and Sec
- Page 28 and 29:
xxvi Enhancing Urban Safety and Sec
- Page 30 and 31:
xxviii Enhancing Urban Safety and S
- Page 32 and 33:
xxx Enhancing Urban Safety and Secu
- Page 34:
xxxii Enhancing Urban Safety and Se
- Page 38 and 39:
4 Understanding Urban Safety and Se
- Page 41 and 42:
1 CHAPTER CURRENT THREATS TO URBAN
- Page 43 and 44:
Current threats to urban safety and
- Page 45 and 46:
Current threats to urban safety and
- Page 47 and 48:
Current threats to urban safety and
- Page 49 and 50:
Current threats to urban safety and
- Page 51 and 52:
Current threats to urban safety and
- Page 53 and 54:
Current threats to urban safety and
- Page 55 and 56:
Current threats to urban safety and
- Page 57 and 58:
2 CHAPTER VULNERABILITY, RISK AND R
- Page 59 and 60:
Vulnerability, risk and resilience:
- Page 61 and 62:
Vulnerability, risk and resilience:
- Page 63 and 64:
29 simply ‘give up’ in the face
- Page 65 and 66:
Vulnerability, risk and resilience:
- Page 67 and 68:
Vulnerability, risk and resilience:
- Page 69 and 70:
Vulnerability, risk and resilience:
- Page 71 and 72:
Vulnerability, risk and resilience:
- Page 73 and 74:
Vulnerability, risk and resilience:
- Page 75:
Vulnerability, risk and resilience:
- Page 80 and 81:
46 Urban crime and violence Box II.
- Page 82 and 83:
48 Urban crime and violence it has
- Page 84 and 85:
50 Urban crime and violence Formal
- Page 86 and 87:
52 Urban crime and violence Contact
- Page 88 and 89:
54 Urban crime and violence Per 100
- Page 90 and 91:
56 Urban crime and violence Burglar
- Page 92 and 93:
58 Urban crime and violence Percent
- Page 94 and 95:
60 Urban crime and violence Figure
- Page 96 and 97:
62 Urban crime and violence Table 3
- Page 98 and 99:
64 Urban crime and violence Youth g
- Page 100 and 101:
66 Urban crime and violence Table 3
- Page 102 and 103:
68 Urban crime and violence Type of
- Page 104 and 105:
70 Urban crime and violence From a
- Page 106 and 107:
72 Urban crime and violence One vio
- Page 108 and 109:
74 Urban crime and violence High ho
- Page 110 and 111:
76 Urban crime and violence Abused
- Page 112 and 113:
78 Urban crime and violence General
- Page 114 and 115:
80 Urban crime and violence Table 3
- Page 116 and 117:
82 Urban crime and violence porate
- Page 118 and 119:
4 CHAPTER URBAN CRIME AND VIOLENCE:
- Page 120 and 121:
86 Urban crime and violence UN-Habi
- Page 122 and 123:
88 Urban crime and violence Box 4.2
- Page 124 and 125:
90 Urban crime and violence Box 4.4
- Page 126 and 127:
92 Urban crime and violence Legisla
- Page 128 and 129:
94 Urban crime and violence above w
- Page 130 and 131:
96 Urban crime and violence Campaig
- Page 132 and 133:
98 Urban crime and violence Availab
- Page 134 and 135:
100 Urban crime and violence Box 4.
- Page 136 and 137:
102 Urban crime and violence In som
- Page 138 and 139:
104 Urban crime and violence Initia
- Page 140 and 141:
106 Urban crime and violence The mo
- Page 142:
108 Urban crime and violence Vander
- Page 146 and 147:
112 Security of tenure Box III.1 Se
- Page 148 and 149:
5 CHAPTER SECURITY OF TENURE: CONDI
- Page 150 and 151:
116 Security of tenure Table 5.1 A
- Page 152 and 153:
118 Security of tenure Fully legal
- Page 154 and 155:
120 Security of tenure Box 5.4 Secu
- Page 156 and 157:
122 Security of tenure Urban tenure
- Page 158 and 159:
124 Security of tenure At least 2 m
- Page 160 and 161:
126 Security of tenure Market-based
- Page 162 and 163:
128 Security of tenure Box 5.11 Urb
- Page 164 and 165:
130 Security of tenure Operation Mu
- Page 166 and 167:
132 Security of tenure Control of l
- Page 168 and 169:
134 Security of tenure Box 5.18 Sec
- Page 170 and 171:
136 Security of tenure NOTES 1 Habi
- Page 172 and 173:
138 Security of tenure Box 6.1 The
- Page 174 and 175:
140 Security of tenure It would be
- Page 176 and 177:
142 Security of tenure Box 6.7 Land
- Page 178 and 179:
144 Security of tenure Box 6.10 Wha
- Page 180 and 181:
146 Security of tenure Box 6.12 Evi
- Page 182 and 183:
148 Security of tenure Box 6.15 Con
- Page 184 and 185:
150 Security of tenure Box 6.18 Vio
- Page 186 and 187:
152 Security of tenure The
- Page 188 and 189:
154 Security of tenure Box 6.24 Lan
- Page 190 and 191:
156 Security of tenure The state is
- Page 192 and 193:
158 Security of tenure Housing righ
- Page 197 and 198:
Over the last three decades, natura
- Page 199 and 200:
Introduction 165 One of the key tre
- Page 201 and 202:
7 CHAPTER DISASTER RISK: CONDITIONS
- Page 203 and 204:
Disaster risk: Conditions, trends a
- Page 205 and 206:
Disaster risk: Conditions, trends a
- Page 207 and 208:
Disaster risk: Conditions, trends a
- Page 209 and 210:
Disaster risk: Conditions, trends a
- Page 211 and 212:
Disaster risk: Conditions, trends a
- Page 213 and 214:
Disaster risk: Conditions, trends a
- Page 215 and 216:
Disaster risk: Conditions, trends a
- Page 217 and 218:
Disaster risk: Conditions, trends a
- Page 219 and 220:
Disaster risk: Conditions, trends a
- Page 221 and 222:
Disaster risk: Conditions, trends a
- Page 223 and 224:
Disaster risk: Conditions, trends a
- Page 225 and 226:
Disaster risk: Conditions, trends a
- Page 227 and 228:
Disaster risk: Conditions, trends a
- Page 229 and 230:
8 CHAPTER POLICY RESPONSES TO DISAS
- Page 231 and 232:
Policy responses to disaster risk 1
- Page 233 and 234:
Policy responses to disaster risk 1
- Page 235 and 236:
Policy responses to disaster risk 2
- Page 237 and 238:
Policy responses to disaster risk 2
- Page 239 and 240:
Policy responses to disaster risk 2
- Page 241 and 242:
Policy responses to disaster risk 2
- Page 243 and 244:
Policy responses to disaster risk 2
- Page 245 and 246:
Policy responses to disaster risk 2
- Page 247 and 248:
Policy responses to disaster risk 2
- Page 249 and 250:
Policy responses to disaster risk 2
- Page 251:
Policy responses to disaster risk 2
- Page 254 and 255:
220 Natural and human-made disaster
- Page 256 and 257:
222 Natural and human-made disaster
- Page 258 and 259:
224 Natural and human-made disaster
- Page 260 and 261:
226 Natural and human-made disaster
- Page 262 and 263:
228 Natural and human-made disaster
- Page 264 and 265:
230 Natural and human-made disaster
- Page 266:
232 Natural and human-made disaster
- Page 270 and 271:
236 Towards safer and more secure c
- Page 272 and 273:
238 Towards safer and more secure c
- Page 274 and 275:
240 Towards safer and more secure c
- Page 276 and 277:
242 Towards safer and more secure c
- Page 278 and 279:
244 Towards safer and more secure c
- Page 280 and 281:
246 Towards safer and more secure c
- Page 282 and 283:
248 Towards safer and more secure c
- Page 284 and 285:
250 Towards safer and more secure c
- Page 286 and 287:
252 Towards safer and more secure c
- Page 288 and 289:
254 Towards safer and more secure c
- Page 290 and 291:
256 Towards safer and more secure c
- Page 292 and 293:
258 Towards safer and more secure c
- Page 294 and 295:
260 Towards safer and more secure c
- Page 296 and 297:
11 CHAPTER ENHANCING TENURE SECURIT
- Page 298 and 299:
264 Towards safer and more secure c
- Page 300 and 301:
266 Towards safer and more secure c
- Page 302 and 303:
268 Towards safer and more secure c
- Page 304 and 305:
270 Towards safer and more secure c
- Page 306 and 307:
272 Towards safer and more secure c
- Page 308 and 309:
274 Towards safer and more secure c
- Page 310 and 311:
276 Enhancing Urban Safety and Secu
- Page 312 and 313:
12 CHAPTER MITIGATING THE IMPACTS O
- Page 314 and 315:
280 Towards safer and more secure c
- Page 316 and 317:
282 Towards safer and more secure c
- Page 318 and 319:
284 Towards safer and more secure c
- Page 320 and 321:
286 Towards safer and more secure c
- Page 322 and 323:
288 Towards safer and more secure c
- Page 324 and 325:
290 Towards safer and more secure c
- Page 326 and 327:
292 Towards safer and more secure c
- Page 328 and 329:
294 Towards safer and more secure c
- Page 330 and 331:
296 Towards safer and more secure c
- Page 332 and 333:
298 Towards safer and more secure c
- Page 334:
300 Towards safer and more secure c
- Page 338 and 339:
304 Summary of case studies Since i
- Page 340 and 341:
306 Summary of case studies • The
- Page 342 and 343:
308 Summary of case studies tions w
- Page 344 and 345:
310 Summary of case studies environ
- Page 346 and 347:
312 Summary of case studies others.
- Page 348 and 349:
314 Summary of case studies purpose
- Page 350 and 351:
316 Summary of case studies These e
- Page 352 and 353:
318 Summary of case studies develop
- Page 354 and 355:
320 Summary of case studies tion ex
- Page 356 and 357:
322 Summary of case studies Housing
- Page 358 and 359:
324 Summary of case studies Prolong
- Page 360:
326 Summary of case studies momentu
- Page 364 and 365:
330 Statistical annex Islands, Micr
- Page 366 and 367:
332 Statistical annex NOMENCLATURE
- Page 368 and 369:
334 Statistical annex Population, u
- Page 370 and 371:
336 Statistical annex SOURCES OF DA
- Page 372 and 373:
338 Enhancing Urban Safety and Secu
- Page 374 and 375: 340 Enhancing Urban Safety and Secu
- Page 376 and 377: 342 Enhancing Urban Safety and Secu
- Page 378 and 379: 344 Enhancing Urban Safety and Secu
- Page 380 and 381: 346 Enhancing Urban Safety and Secu
- Page 382 and 383: 348 Enhancing Urban Safety and Secu
- Page 384 and 385: 350 Enhancing Urban Safety and Secu
- Page 386 and 387: 352 Enhancing Urban Safety and Secu
- Page 388 and 389: 354 Enhancing Urban Safety and Secu
- Page 390 and 391: 356 Enhancing Urban Safety and Secu
- Page 392 and 393: 358 Enhancing Urban Safety and Secu
- Page 394 and 395: 360 Enhancing Urban Safety and Secu
- Page 396 and 397: 362 Enhancing Urban Safety and Secu
- Page 398 and 399: 364 Enhancing Urban Safety and Secu
- Page 400 and 401: 366 Enhancing Urban Safety and Secu
- Page 402 and 403: 368 Enhancing Urban Safety and Secu
- Page 404 and 405: 370 Enhancing Urban Safety and Secu
- Page 406 and 407: 372 Enhancing Urban Safety and Secu
- Page 408 and 409: 374 Enhancing Urban Safety and Secu
- Page 410 and 411: 376 Enhancing Urban Safety and Secu
- Page 412 and 413: 378 Enhancing Urban Safety and Secu
- Page 414 and 415: 380 Enhancing Urban Safety and Secu
- Page 416 and 417: 382 Enhancing Urban Safety and Secu
- Page 418 and 419: 384 Enhancing Urban Safety and Secu
- Page 420 and 421: 386 Enhancing Urban Safety and Secu
- Page 422 and 423: 388 Enhancing Urban Safety and Secu
- Page 426 and 427: 392 Enhancing Urban Safety and Secu
- Page 428 and 429: 394 Enhancing Urban Safety and Secu
- Page 430 and 431: 396 Enhancing Urban Safety and Secu
- Page 432 and 433: 398 Enhancing Urban Safety and Secu
- Page 434 and 435: 400 Enhancing Urban Safety and Secu
- Page 436 and 437: 402 Enhancing Urban Safety and Secu
- Page 438 and 439: 404 Enhancing Urban Safety and Secu
- Page 440 and 441: 406 Enhancing Urban Safety and Secu
- Page 442 and 443: 408 Enhancing Urban Safety and Secu
- Page 444 and 445: 410 TABLE C.7 continued Enhancing U
- Page 446 and 447: 412 Enhancing Urban Safety and Secu
- Page 448 and 449: 414 Enhancing Urban Safety and Secu
- Page 450 and 451: 416 Enhancing Urban Safety and Secu
- Page 452 and 453: 418 Enhancing Urban Safety and Secu
- Page 454 and 455: 420 Enhancing Urban Safety and Secu
- Page 456 and 457: 422 Enhancing Urban Safety and Secu
- Page 458 and 459: 424 Enhancing Urban Safety and Secu
- Page 460 and 461: 426 Enhancing Urban Safety and Secu
- Page 462 and 463: 428 Enhancing Urban Safety and Secu
- Page 464 and 465: 430 Enhancing Urban Safety and Secu
- Page 467 and 468: INDEX ACHR (Asian Coalition for Hou
- Page 469 and 470: Index 435 security of tenure 134 co
- Page 471 and 472: Index 437 domestic abuse see intima
- Page 473 and 474: Index 439 hazard management 169 haz
- Page 475 and 476:
Index 441 Kosovo, security of tenur
- Page 477 and 478:
Index 443 participation 38, 296-299
- Page 479 and 480:
Index 445 individual 34-35 municipa
- Page 481 and 482:
Index 447 gun ownership 78 Homeless