Global Report on Human Settlements 2007 - PoA-ISS
Global Report on Human Settlements 2007 - PoA-ISS
Global Report on Human Settlements 2007 - PoA-ISS

You also want an ePaper? Increase the reach of your titles
YUMPU automatically turns print PDFs into web optimized ePapers that Google loves.
Data tables<br />
343<br />
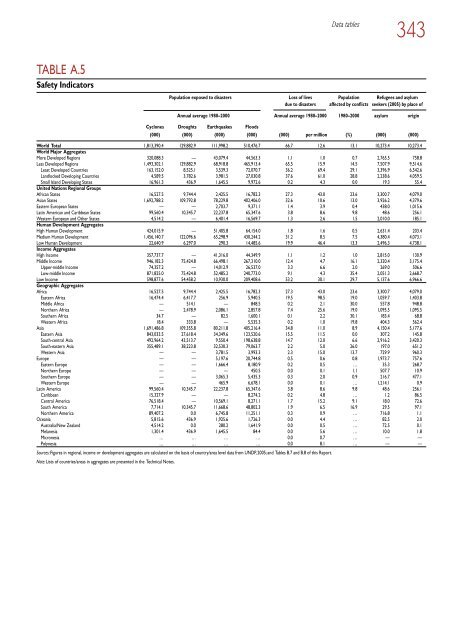
TABLE A.5<br />
Safety Indicators<br />
World Total 1,813,390.4 129,882.9 111,998.2 510,476.7 66.7 12.6 13.1 10,273.4 10,273.4<br />
World Major Aggregates<br />
More Developed Regi<strong>on</strong>s 320,088.3 — 43,079.4 44,563.3 1.1 1.0 0.7 2,765.5 758.8<br />
Less Developed Regi<strong>on</strong>s 1,493,302.1 129,882.9 68,918.8 465,913.4 65.5 15.9 14.5 7,507.9 9,514.6<br />
Least Developed Countries 163,152.0 8,525.1 3,539.3 72,070.7 36.2 69.4 29.1 3,396.9 6,542.6<br />
Landlocked Developing Countries 4,589.5 3,782.6 3,981.5 27,030.8 37.6 61.0 28.8 2,238.6 4,059.5<br />
Small Island Developing States 16,961.3 436.9 1,645.5 9,972.6 0.2 4.3 0.0 19.3 55.4<br />
United Nati<strong>on</strong>s Regi<strong>on</strong>al Groups<br />
African States 16,527.5 9,744.4 2,425.5 16,782.3 27.3 43.0 23.6 3,300.7 4,079.0<br />
Asian States 1,692,788.2 109,792.8 78,229.8 402,406.0 32.6 10.6 13.0 3,926.2 4,379.6<br />
Eastern European States — — 2,703.7 9,371.1 1.4 3.9 0.4 438.0 1,015.6<br />
Latin American and Caribbean States 99,560.4 10,345.7 22,237.8 65,347.6 3.8 8.6 9.8 48.6 256.1<br />
Western European and Other States 4,514.2 — 6,401.4 16,569.7 1.3 2.6 1.5 2,010.0 185.1<br />
<strong>Human</strong> Development Aggregates<br />
High <strong>Human</strong> Development 424,015.9 — 51,405.8 64,154.0 1.8 1.6 0.5 2,631.4 203.4<br />
Medium <strong>Human</strong> Development 1,456,140.7 122,096.6 65,298.9 430,244.2 31.2 8.5 7.5 4,380.4 4,073.1<br />
Low <strong>Human</strong> Development 22,640.9 6,297.0 290.3 14,485.6 19.9 46.4 13.3 2,496.3 4,738.1<br />
Income Aggregates<br />
High Income 357,737.7 — 41,316.0 44,349.9 1.1 1.2 1.0 2,815.0 130.9<br />
Middle Income 946,182.3 75,424.8 66,498.1 267,310.0 12.4 4.7 16.1 2,320.4 3,175.4<br />
Upper-middle Income 74,357.2 — 14,012.9 26,537.0 3.3 6.6 2.0 269.0 506.6<br />
Low-middle Income 871,825.0 75,424.8 52,485.2 240,773.0 9.1 4.3 35.4 2,051.3 2,668.7<br />
Low Income 598,877.6 54,458.2 10,930.0 209,408.6 53.2 30.1 29.7 5,137.6 6,966.6<br />
Geographic Aggregates<br />
Africa 16,527.5 9,744.4 2,425.5 16,782.3 27.3 43.0 23.6 3,300.7 4,079.0<br />
Eastern Africa 16,474.4 6,417.7 256.9 5,940.5 19.5 98.5 19.0 1,059.7 1,403.8<br />
Middle Africa — 514.1 — 848.5 0.2 2.1 30.0 557.8 948.8<br />
Northern Africa — 2,478.9 2,086.1 2,857.8 7.4 25.6 19.0 1,095.5 1,095.5<br />
Southern Africa 34.7 — 82.5 1,600.1 0.1 2.2 30.1 183.4 68.8<br />
Western Africa 18.4 333.8 — 5,535.3 0.2 1.0 19.8 404.3 562.4<br />
Asia 1,691,486.8 109,355.8 80,211.8 405,216.4 34.8 11.0 8.9 4,150.4 5,177.6<br />
Eastern Asia 843,033.5 27,618.4 34,349.6 123,520.6 15.5 11.5 0.0 307.2 145.8<br />
South-central Asia 492,964.2 43,513.7 9,550.4 198,638.8 14.7 12.0 6.6 2,916.2 3,420.3<br />
South-eastern Asia 355,489.1 38,223.8 32,530.3 79,063.7 2.2 5.0 26.0 197.0 651.2<br />
Western Asia — — 3,781.5 3,993.3 2.3 15.0 13.7 729.9 960.3<br />
Europe — — 5,197.6 20,744.8 0.5 0.6 0.8 1,973.7 757.6<br />
Eastern Europe — — 1,666.4 8,180.9 0.2 0.5 … 35.3 268.7<br />
Northern Europe — — — 450.5 0.0 0.1 1.1 507.7 10.9<br />
Southern Europe — — 3,065.3 5,435.3 0.3 2.0 0.9 216.7 477.1<br />
Western Europe — — 465.9 6,678.1 0.0 0.1 … 1,214.1 0.9<br />
Latin America 99,560.4 10,345.7 22,237.8 65,347.6 3.8 8.6 9.8 48.6 256.1<br />
Caribbean 15,327.9 — — 8,274.2 0.2 4.8 … 1.2 86.5<br />
Central America 76,518.4 — 10,569.1 8,271.1 1.7 15.2 9.1 18.0 72.6<br />
South America 7,714.1 10,345.7 11,668.6 48,802.3 1.9 6.5 16.9 29.5 97.1<br />
Northern America 89,407.2 0.0 6,745.8 11,251.1 0.3 0.9 … 716.8 1.1<br />
Oceania 5,815.6 436.9 1,925.6 1,726.3 0.0 4.4 … 82.5 2.0<br />
Australia/New Zealand 4,514.2 0.0 280.2 1,641.9 0.0 0.5 … 72.5 0.1<br />
Melanesia 1,301.4 436.9 1,645.5 84.4 0.0 5.6 … 10.0 1.8<br />
Micr<strong>on</strong>esia … … … … 0.0 0.7 … — —<br />
Polynesia … … … … 0.0 8.1 … — —<br />
Sources: Figures in regi<strong>on</strong>al, income or development aggregates are calculated <strong>on</strong> the basis of country/area level data from UNDP, 2005; and Tables B.7 and B.8 of this <str<strong>on</strong>g>Report</str<strong>on</strong>g>.<br />
Note: Lists of countries/areas in aggregates are presented in the Technical Notes.<br />
Populati<strong>on</strong> exposed to disasters Loss of lives Populati<strong>on</strong> Refugees and asylum<br />
due to disasters affected by c<strong>on</strong>flicts seekers (2005) by place of<br />
Annual average 1980–2000 Annual average 1980–2000 1980–2000 asylum origin<br />
Cycl<strong>on</strong>es Droughts Earthquakes Floods<br />
(000) (000) (000) (000) (000) per milli<strong>on</strong> (%) (000) (000)