Global Report on Human Settlements 2007 - PoA-ISS
Global Report on Human Settlements 2007 - PoA-ISS
Global Report on Human Settlements 2007 - PoA-ISS

Create successful ePaper yourself
Turn your PDF publications into a flip-book with our unique Google optimized e-Paper software.
196<br />
Natural and human-made disasters<br />
…technical<br />
advances … for<br />
hazard mapping …<br />
are often lacking in<br />
developing<br />
countries…<br />
envir<strong>on</strong>ment vis-à-vis an analysis of exposure to hazard and<br />
susceptibility to harm, as well as capacity to resp<strong>on</strong>d to disasters.<br />
Hazard and risk assessments employ a range of<br />
techniques, from quantitative analysis built around scenario<br />
modelling and mapping to qualitative, n<strong>on</strong>-technical<br />
approaches, depending up<strong>on</strong> the kinds of data that need to<br />
be generated.<br />
Hazard mapping<br />
Hazard assessment involves an analysis of the likelihood of<br />
occurrence of natural or human-made hazards in a specific<br />
future time period, including their intensity and area of<br />
impact. 4 Data generated through hazard assessments needs<br />
to be presented to decisi<strong>on</strong>-makers and communities at risk<br />
to raise awareness and enable the design of appropriate<br />
interventi<strong>on</strong>s and policies. One approach is the use of maps<br />
to depict the spatial locati<strong>on</strong>, size and frequency of hazards.<br />
This allows general statements to be made about the<br />
exposure of nati<strong>on</strong>al urban systems and individual cities to<br />
hazards.<br />
■ Mapping natural hazard<br />
At the global scale, hazard mapping is well advanced for<br />
volcanic, earthquake, flood, wind and landslide hazards. 5<br />
Many countries also have nati<strong>on</strong>al hazard maps, particularly<br />
of geophysical hazards. While global- and nati<strong>on</strong>al-scale<br />
hazard maps can help to identify nati<strong>on</strong>al legislative or policy<br />
planning priorities, planning at the city level requires more<br />
detailed informati<strong>on</strong>. Many cities in middle- and highincome<br />
countries, particularly those which are<br />
administrative or industrial centres, have detailed single and<br />
multi-hazard maps. During the last decade, the number of<br />
cities with seismic hazard maps has increased. 6 Other<br />
hazards, such as flooding and extreme temperatures, vary<br />
spatially, requiring more c<strong>on</strong>tinuous m<strong>on</strong>itoring and<br />
mapping, which can be more costly.<br />
The advent of geographic informati<strong>on</strong> systems (GIS),<br />
coupled with satellite imagery of disaster events, have<br />
revoluti<strong>on</strong>ized the amount of data that is now available<br />
worldwide. While technical advances have increased the<br />
potential for hazard mapping, they have also generated<br />
inequalities in hazard assessment capacities. Technical<br />
approaches require financial investment in hardware and<br />
human resources that are often lacking in developing<br />
countries and are bey<strong>on</strong>d reach for poorer urban authorities.<br />
Partnerships between technical advisory bodies and nati<strong>on</strong>al<br />
centres for disaster management offer a potential mechanism<br />
for technology and skill transfer. One example of this is<br />
the Government of India–United Nati<strong>on</strong>s Development<br />
Programme (UNDP) Urban Earthquake Vulnerability<br />
Reducti<strong>on</strong> Project, shown in Box 8.1. 7<br />
Low-impact, high-frequency hazards are less likely to<br />
be mapped, despite their erosive impact <strong>on</strong> human health<br />
Box 8.1 India’s nati<strong>on</strong>al hazard map: A foundati<strong>on</strong> for coordinated disaster risk reducti<strong>on</strong><br />
An example of cooperati<strong>on</strong> in disaster risk reducti<strong>on</strong><br />
between an internati<strong>on</strong>al organizati<strong>on</strong> and a nati<strong>on</strong>al government<br />
is the Government of India–United Nati<strong>on</strong>s<br />
Development Programme (UNDP) Disaster Risk<br />
Management Programme. A key subcomp<strong>on</strong>ent of this<br />
programme is the Urban Earthquake Vulnerability Reducti<strong>on</strong><br />
Project, implemented between 2003 and <strong>2007</strong>. The project<br />
aims to raise awareness of earthquake risk in urban areas<br />
am<strong>on</strong>g decisi<strong>on</strong>-makers and the public and to improve disaster<br />
preparedness.<br />
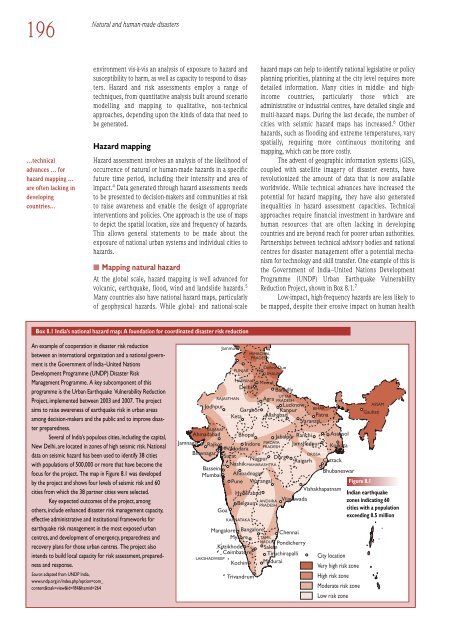
Several of India’s populous cities, including the capital,<br />
New Delhi, are located in z<strong>on</strong>es of high seismic risk. Nati<strong>on</strong>al<br />
data <strong>on</strong> seismic hazard has been used to identify 38 cities<br />
with populati<strong>on</strong>s of 500,000 or more that have become the<br />
focus for the project. The map in Figure 8.1 was developed<br />
by the project and shows four levels of seismic risk and 60<br />
cities from which the 38 partner cities were selected.<br />
Key expected outcomes of the project, am<strong>on</strong>g<br />
others, include enhanced disaster risk management capacity,<br />
effective administrative and instituti<strong>on</strong>al frameworks for<br />
earthquake risk management in the most exposed urban<br />
centres, and development of emergency, preparedness and<br />
recovery plans for those urban centres. The project also<br />
intends to build local capacity for risk assessment, preparedness<br />
and resp<strong>on</strong>se.<br />
Source: adapted from UNDP India,<br />
www.undp.org.in/index.php?opti<strong>on</strong>=com_<br />
c<strong>on</strong>tent&task=view&id=?84&Itemid=264<br />
Jammu<br />
HARYANA Meend<br />
Delhi<br />
Banhilly<br />
UTTAR<br />
RAJASTHAN Agra PRADESH<br />
Jodhpur<br />
Lucknow<br />
Garabor Kanpur<br />
BIHAR<br />
Keta Allahabad Patna<br />
Varanasi<br />
GUJARAT<br />
Ahmadabad Bhopal Jabalpur Ranchi Asansol<br />
Jamnagar Rajkot Indore<br />
MADAYA Jamshedpur<br />
PRADESH<br />
Kolkata<br />
Vadodara<br />
Bhavnagar<br />
OR<strong>ISS</strong>A<br />
Surat<br />
Nagpur Durg<br />
Raigarh Cuttack<br />
Nashik MAHARASHTRA<br />
Bassein<br />
Ahmadnagar<br />
Bhubaneswar<br />
Mumbai<br />
Pune Warangal<br />
Figure 8.1<br />
Vishakhapatnam<br />
Hyderabad<br />
Indian earthquake<br />
ANDHRA Vijayawada<br />
z<strong>on</strong>es indicating 60<br />
Belgaum PRADESH<br />
Goa<br />
cities with a populati<strong>on</strong><br />
exceeding 0.5 milli<strong>on</strong><br />
Mangalore Bangalore<br />
Chennai<br />
Mysore TAMIL<br />
NADU P<strong>on</strong>dicherry<br />
Kozikhode Salem<br />
Coimbatore Tiruchirapalli<br />
Kochin Madurai<br />
LAKSHADWEEP<br />
PUNJAB<br />
KARNATAKA<br />
Trivandrum<br />
HIMACHAL<br />
PRADESH<br />
Dehra Dun<br />
KUMAUN<br />
City locati<strong>on</strong><br />
Very high risk z<strong>on</strong>e<br />
High risk z<strong>on</strong>e<br />
Moderate risk z<strong>on</strong>e<br />
Low risk z<strong>on</strong>e<br />
ASSAM<br />
Gauhati