Global Report on Human Settlements 2007 - PoA-ISS
Global Report on Human Settlements 2007 - PoA-ISS
Global Report on Human Settlements 2007 - PoA-ISS

Create successful ePaper yourself
Turn your PDF publications into a flip-book with our unique Google optimized e-Paper software.
Policy resp<strong>on</strong>ses to disaster risk<br />
197<br />
and livelihoods. This gap has been filled in some neighbourhoods<br />
by community-based hazard and risk mapping<br />
projects. This data, combined with nati<strong>on</strong>al- and city-level<br />
records of past events, can be used to identify priorities for<br />
urban planning and c<strong>on</strong>structi<strong>on</strong> standards.<br />
Less informati<strong>on</strong> is available at the global scale for<br />
hazards that affect the lifelines to a city such as drought, or<br />
emerging hazards such as heat and cold shocks. <str<strong>on</strong>g>Global</str<strong>on</strong>g>-scale<br />
data can be used to extend analyses of hazard exposure<br />
bey<strong>on</strong>d the municipal boundary to dem<strong>on</strong>strate the vulnerability<br />
of cities to disasters affecting their hinterland by<br />
disrupting trade, or blocking access and flows of resources<br />
and waste.<br />
■ Mapping human-made hazard<br />
Nati<strong>on</strong>al directories of human-made hazards are becoming<br />
more comm<strong>on</strong>, and many are open to the public. In the UK,<br />
the Envir<strong>on</strong>ment Agency hosts a polluti<strong>on</strong> and hazardous<br />
waste sites inventory. This is searchable by postal code and<br />
also provides informati<strong>on</strong> <strong>on</strong> water quality and flood hazard. 8<br />
In the US, Green Media’s Toolshed website includes a<br />
searchable scorecard, which provides data <strong>on</strong> chemicals<br />
being released from any of 20,000 industrial facilities, or a<br />
summary report for any area in the country. 9 More difficult<br />
is the mapping of human-made risk associated with industrial<br />
facilities, buildings’ integrity or transport infrastructure.<br />
Much of the informati<strong>on</strong> needed to build comparative<br />
hazard datasets is commercially valuable and therefore not<br />
released to the public.<br />
Local authority land-use planning maps and schedules<br />
include informati<strong>on</strong> <strong>on</strong> industrial sites where hazardous<br />
activities are undertaken, and can be used as a basis for<br />
urban industrial hazard mapping. This is particularly valuable<br />
for assessing the risk of human-made disasters caused by<br />
natural hazards. More difficult is the acquisiti<strong>on</strong> of data <strong>on</strong><br />
informal-sector industrial activities, such as tanneries or<br />
fireworks factories. These might not represent a significant<br />
hazard individually; but, in aggregate, unplanned industrial<br />
activity is a major risk to health from air, water and ground<br />
polluti<strong>on</strong> and from fire and explosi<strong>on</strong> hazards. Risk is heightened<br />
because of the unregulated nature of informal<br />
industrial activity and its close proximity to densely settled<br />
residential areas.<br />
Risk assessments for individual cities<br />
As noted in Chapter 7, there is limited comparative data <strong>on</strong><br />
natural disaster risk and impacts at the city level. Two initiatives<br />
have made major c<strong>on</strong>tributi<strong>on</strong>s at this level of analysis –<br />
namely, the Natural Hazards Risk Index for Megacities by<br />
Munich Re (see Chapter 7) 10 and the Earthquake Disaster<br />
Risk Index used by GeoHazards Internati<strong>on</strong>al (GHI).<br />
GHI developed and applied an Earthquake Lethality<br />
Estimati<strong>on</strong> Method in 2000/2001. The method produces<br />
results that indicate the relative severity of earthquake risk,<br />
the sources of risk within each city, and the relative effectiveness<br />
of potential mitigati<strong>on</strong> opti<strong>on</strong>s. The same results are<br />
also produced for the exposure of school children to collapse<br />
of educati<strong>on</strong>al buildings. The method was applied to cities in<br />
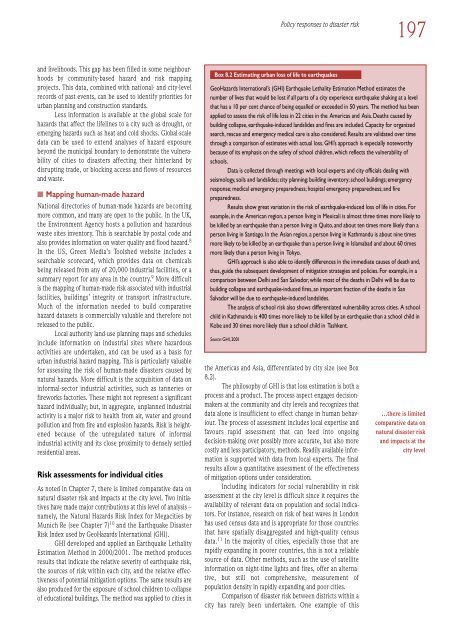
Box 8.2 Estimating urban loss of life to earthquakes<br />
GeoHazards Internati<strong>on</strong>al’s (GHI) Earthquake Lethality Estimati<strong>on</strong> Method estimates the<br />
number of lives that would be lost if all parts of a city experience earthquake shaking at a level<br />
that has a 10 per cent chance of being equalled or exceeded in 50 years. The method has been<br />
applied to assess the risk of life loss in 22 cities in the Americas and Asia. Deaths caused by<br />
building collapse, earthquake-induced landslides and fires are included. Capacity for organized<br />
search, rescue and emergency medical care is also c<strong>on</strong>sidered. Results are validated over time<br />
through a comparis<strong>on</strong> of estimates with actual loss. GHI’s approach is especially noteworthy<br />
because of its emphasis <strong>on</strong> the safety of school children, which reflects the vulnerability of<br />
schools.<br />
Data is collected through meetings with local experts and city officials dealing with<br />
seismology, soils and landslides; city planning; building inventory; school buildings; emergency<br />
resp<strong>on</strong>se; medical emergency preparedness; hospital emergency preparedness; and fire<br />
preparedness.<br />
Results show great variati<strong>on</strong> in the risk of earthquake-induced loss of life in cities. For<br />
example, in the American regi<strong>on</strong>, a pers<strong>on</strong> living in Mexicali is almost three times more likely to<br />
be killed by an earthquake than a pers<strong>on</strong> living in Quito, and about ten times more likely than a<br />
pers<strong>on</strong> living in Santiago. In the Asian regi<strong>on</strong>, a pers<strong>on</strong> living in Kathmandu is about nine times<br />
more likely to be killed by an earthquake than a pers<strong>on</strong> living in Islamabad and about 60 times<br />
more likely than a pers<strong>on</strong> living in Tokyo.<br />
GHI’s approach is also able to identify differences in the immediate causes of death and,<br />
thus, guide the subsequent development of mitigati<strong>on</strong> strategies and policies. For example, in a<br />
comparis<strong>on</strong> between Delhi and San Salvador, while most of the deaths in Delhi will be due to<br />
building collapse and earthquake-induced fires, an important fracti<strong>on</strong> of the deaths in San<br />
Salvador will be due to earthquake-induced landslides.<br />
The analysis of school risk also shows differentiated vulnerability across cities. A school<br />
child in Kathmandu is 400 times more likely to be killed by an earthquake than a school child in<br />
Kobe and 30 times more likely than a school child in Tashkent.<br />
Source: GHI, 2001<br />
the Americas and Asia, differentiated by city size (see Box<br />
8.2).<br />
The philosophy of GHI is that loss estimati<strong>on</strong> is both a<br />
process and a product. The process aspect engages decisi<strong>on</strong>makers<br />
at the community and city levels and recognizes that<br />
data al<strong>on</strong>e is insufficient to effect change in human behaviour.<br />
The process of assessment includes local expertise and<br />
favours rapid assessment that can feed into <strong>on</strong>going<br />
decisi<strong>on</strong>-making over possibly more accurate, but also more<br />
costly and less participatory, methods. Readily available informati<strong>on</strong><br />
is supported with data from local experts. The final<br />
results allow a quantitative assessment of the effectiveness<br />
of mitigati<strong>on</strong> opti<strong>on</strong>s under c<strong>on</strong>siderati<strong>on</strong>.<br />
Including indicators for social vulnerability in risk<br />
assessment at the city level is difficult since it requires the<br />
availability of relevant data <strong>on</strong> populati<strong>on</strong> and social indicators.<br />
For instance, research <strong>on</strong> risk of heat waves in L<strong>on</strong>d<strong>on</strong><br />
has used census data and is appropriate for those countries<br />
that have spatially disaggregated and high-quality census<br />
data. 11 In the majority of cities, especially those that are<br />
rapidly expanding in poorer countries, this is not a reliable<br />
source of data. Other methods, such as the use of satellite<br />
informati<strong>on</strong> <strong>on</strong> night-time lights and fires, offer an alternative,<br />
but still not comprehensive, measurement of<br />
populati<strong>on</strong> density in rapidly expanding and poor cities.<br />
Comparis<strong>on</strong> of disaster risk between districts within a<br />
city has rarely been undertaken. One example of this<br />
…there is limited<br />
comparative data <strong>on</strong><br />
natural disaster risk<br />
and impacts at the<br />
city level