Global Report on Human Settlements 2007 - PoA-ISS
Global Report on Human Settlements 2007 - PoA-ISS
Global Report on Human Settlements 2007 - PoA-ISS

You also want an ePaper? Increase the reach of your titles
YUMPU automatically turns print PDFs into web optimized ePapers that Google loves.
192<br />
Natural and human-made disasters<br />
Table 7.12<br />
Disaster incidence and<br />
impacts in Europe<br />
(1996–2005)<br />
Note: For all disaster types,<br />
small events with less than 10<br />
mortalities or 100 affected<br />
people are not included.<br />
Source: EM-DAT, CRED<br />
database, University of<br />
Louvain, Belgium, www.emdat.net<br />
Number of events Mortality People affected (thousands) Ec<strong>on</strong>omic loss (US$<br />
milli<strong>on</strong>, 2005 value)<br />
Avalanches/landslides 18 389 14 20<br />
Drought/famines 14 0 1063 8019<br />
Earthquakes/tsunamis 52 18,584 4016 29,609<br />
Extreme temperatures 79 48,630 771 6706<br />
Floods 229 1422 5048 47,860<br />
Volcanic erupti<strong>on</strong>s 2 0 0 24<br />
Windstorms 110 610 7025 18,138<br />
Industrial accidents 56 844 71 11,100<br />
Miscellaneous accidents 73 1474 14 874<br />
Oceania records the<br />
lowest incidence of<br />
disasters for any<br />
regi<strong>on</strong> and hazard<br />
type…<br />
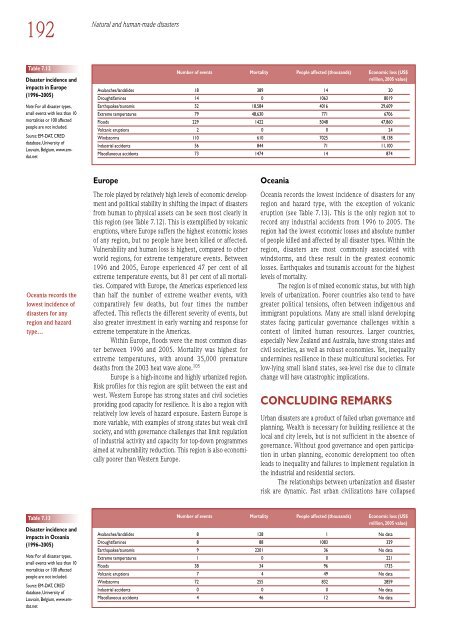
Europe<br />
The role played by relatively high levels of ec<strong>on</strong>omic development<br />
and political stability in shifting the impact of disasters<br />
from human to physical assets can be seen most clearly in<br />
this regi<strong>on</strong> (see Table 7.12). This is exemplified by volcanic<br />
erupti<strong>on</strong>s, where Europe suffers the highest ec<strong>on</strong>omic losses<br />
of any regi<strong>on</strong>, but no people have been killed or affected.<br />
Vulnerability and human loss is highest, compared to other<br />
world regi<strong>on</strong>s, for extreme temperature events. Between<br />
1996 and 2005, Europe experienced 47 per cent of all<br />
extreme temperature events, but 81 per cent of all mortalities.<br />
Compared with Europe, the Americas experienced less<br />
than half the number of extreme weather events, with<br />
comparatively few deaths, but four times the number<br />
affected. This reflects the different severity of events, but<br />
also greater investment in early warning and resp<strong>on</strong>se for<br />
extreme temperature in the Americas.<br />
Within Europe, floods were the most comm<strong>on</strong> disaster<br />
between 1996 and 2005. Mortality was highest for<br />
extreme temperatures, with around 35,000 premature<br />
deaths from the 2003 heat wave al<strong>on</strong>e. 105<br />
Europe is a high-income and highly urbanized regi<strong>on</strong>.<br />
Risk profiles for this regi<strong>on</strong> are split between the east and<br />
west. Western Europe has str<strong>on</strong>g states and civil societies<br />
providing good capacity for resilience. It is also a regi<strong>on</strong> with<br />
relatively low levels of hazard exposure. Eastern Europe is<br />
more variable, with examples of str<strong>on</strong>g states but weak civil<br />
society, and with governance challenges that limit regulati<strong>on</strong><br />
of industrial activity and capacity for top-down programmes<br />
aimed at vulnerability reducti<strong>on</strong>. This regi<strong>on</strong> is also ec<strong>on</strong>omically<br />
poorer than Western Europe.<br />
Oceania<br />
Oceania records the lowest incidence of disasters for any<br />
regi<strong>on</strong> and hazard type, with the excepti<strong>on</strong> of volcanic<br />
erupti<strong>on</strong> (see Table 7.13). This is the <strong>on</strong>ly regi<strong>on</strong> not to<br />
record any industrial accidents from 1996 to 2005. The<br />
regi<strong>on</strong> had the lowest ec<strong>on</strong>omic losses and absolute number<br />
of people killed and affected by all disaster types. Within the<br />
regi<strong>on</strong>, disasters are most comm<strong>on</strong>ly associated with<br />
windstorms, and these result in the greatest ec<strong>on</strong>omic<br />
losses. Earthquakes and tsunamis account for the highest<br />
levels of mortality.<br />
The regi<strong>on</strong> is of mixed ec<strong>on</strong>omic status, but with high<br />
levels of urbanizati<strong>on</strong>. Poorer countries also tend to have<br />
greater political tensi<strong>on</strong>s, often between indigenous and<br />
immigrant populati<strong>on</strong>s. Many are small island developing<br />
states facing particular governance challenges within a<br />
c<strong>on</strong>text of limited human resources. Larger countries,<br />
especially New Zealand and Australia, have str<strong>on</strong>g states and<br />
civil societies, as well as robust ec<strong>on</strong>omies. Yet, inequality<br />
undermines resilience in these multicultural societies. For<br />
low-lying small island states, sea-level rise due to climate<br />
change will have catastrophic implicati<strong>on</strong>s.<br />
CONCLUDING REMARKS<br />
Urban disasters are a product of failed urban governance and<br />
planning. Wealth is necessary for building resilience at the<br />
local and city levels, but is not sufficient in the absence of<br />
governance. Without good governance and open participati<strong>on</strong><br />
in urban planning, ec<strong>on</strong>omic development too often<br />
leads to inequality and failures to implement regulati<strong>on</strong> in<br />
the industrial and residential sectors.<br />
The relati<strong>on</strong>ships between urbanizati<strong>on</strong> and disaster<br />
risk are dynamic. Past urban civilizati<strong>on</strong>s have collapsed<br />
Table 7.13<br />
Disaster incidence and<br />
impacts in Oceania<br />
(1996–2005)<br />
Note: For all disaster types,<br />
small events with less than 10<br />
mortalities or 100 affected<br />
people are not included.<br />
Source: EM-DAT, CRED<br />
database, University of<br />
Louvain, Belgium, www.emdat.net<br />
Number of events Mortality People affected (thousands) Ec<strong>on</strong>omic loss (US$<br />
milli<strong>on</strong>, 2005 value)<br />
Avalanches/landslides 8 128 1 No data<br />
Drought/famines 8 88 1083 329<br />
Earthquakes/tsunamis 9 2201 36 No data<br />
Extreme temperatures 1 0 0 221<br />
Floods 38 34 96 1735<br />
Volcanic erupti<strong>on</strong>s 7 4 49 No data<br />
Windstorms 72 255 832 2859<br />
Industrial accidents 0 0 0 No data<br />
Miscellaneous accidents 4 46 12 No data