Global Report on Human Settlements 2007 - PoA-ISS
Global Report on Human Settlements 2007 - PoA-ISS
Global Report on Human Settlements 2007 - PoA-ISS

Create successful ePaper yourself
Turn your PDF publications into a flip-book with our unique Google optimized e-Paper software.
Urban crime and violence: C<strong>on</strong>diti<strong>on</strong>s and trends<br />
53<br />
robbery, as well as property crime, indicated by burglary – a<br />
n<strong>on</strong>-violent but n<strong>on</strong>etheless serious crime. Furthermore,<br />
this chapter c<strong>on</strong>siders a variety of public order offences,<br />
such as corrupti<strong>on</strong>, organized crime and trafficking offences,<br />
including drugs, arms and human trafficking.<br />
10,000<br />
8000<br />
North<br />
America<br />
THE INCIDENCE AND<br />
VARIABILITY OF CRIME AND<br />
VIOLENCE<br />
Crimes and violence are unevenly distributed across the<br />
globe and within nati<strong>on</strong>s and cities. Nevertheless, they are<br />
pernicious, c<strong>on</strong>tinuing threats to human security, generally,<br />
and especially for the poor, who are disproporti<strong>on</strong>ately<br />
victimized as individuals and whose communities are<br />
str<strong>on</strong>gly affected. While crime and violence must be c<strong>on</strong>sidered<br />
through the lens of unique local c<strong>on</strong>texts and<br />
circumstances, trends in crime and violence can also be seen<br />
at much broader levels. This secti<strong>on</strong> reviews some of the<br />
global, regi<strong>on</strong>al, nati<strong>on</strong>al and city data for serious c<strong>on</strong>tact,<br />
property and public order crimes.<br />
<str<strong>on</strong>g>Global</str<strong>on</strong>g> and regi<strong>on</strong>al crime c<strong>on</strong>diti<strong>on</strong>s and<br />
trends<br />
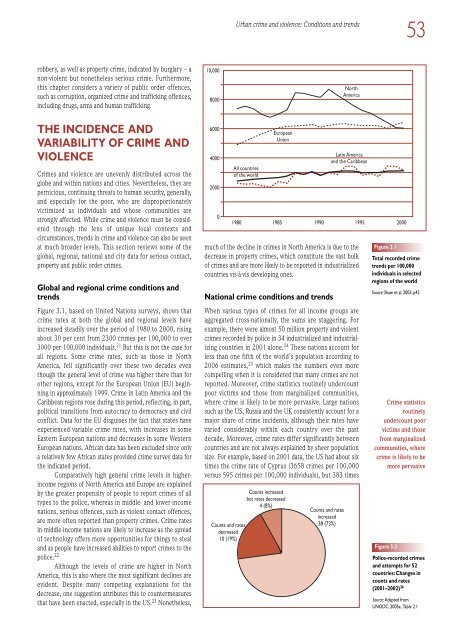
Figure 3.1, based <strong>on</strong> United Nati<strong>on</strong>s surveys, shows that<br />
crime rates at both the global and regi<strong>on</strong>al levels have<br />
increased steadily over the period of 1980 to 2000, rising<br />
about 30 per cent from 2300 crimes per 100,000 to over<br />
3000 per 100,000 individuals. 21 But this is not the case for<br />
all regi<strong>on</strong>s. Some crime rates, such as those in North<br />
America, fell significantly over these two decades even<br />
though the general level of crime was higher there than for<br />
other regi<strong>on</strong>s, except for the European Uni<strong>on</strong> (EU) beginning<br />
in approximately 1999. Crime in Latin America and the<br />
Caribbean regi<strong>on</strong>s rose during this period, reflecting, in part,<br />
political transiti<strong>on</strong>s from autocracy to democracy and civil<br />
c<strong>on</strong>flict. Data for the EU disguises the fact that states have<br />
experienced variable crime rates, with increases in some<br />
Eastern European nati<strong>on</strong>s and decreases in some Western<br />
European nati<strong>on</strong>s. African data has been excluded since <strong>on</strong>ly<br />
a relatively few African states provided crime survey data for<br />
the indicated period.<br />
Comparatively high general crime levels in higherincome<br />
regi<strong>on</strong>s of North America and Europe are explained<br />
by the greater propensity of people to report crimes of all<br />
types to the police, whereas in middle- and lower-income<br />
nati<strong>on</strong>s, serious offences, such as violent c<strong>on</strong>tact offences,<br />
are more often reported than property crimes. Crime rates<br />
in middle-income nati<strong>on</strong>s are likely to increase as the spread<br />
of technology offers more opportunities for things to steal<br />
and as people have increased abilities to report crimes to the<br />
police. 22<br />
Although the levels of crime are higher in North<br />
America, this is also where the most significant declines are<br />
evident. Despite many competing explanati<strong>on</strong>s for the<br />
decrease, <strong>on</strong>e suggesti<strong>on</strong> attributes this to countermeasures<br />
that have been enacted, especially in the US. 23 N<strong>on</strong>etheless,<br />
6000<br />
4000<br />
2000<br />
0<br />
All countries<br />
of the world<br />
European<br />
Uni<strong>on</strong><br />
1980 1985 1990 1995<br />
2000<br />
much of the decline in crimes in North America is due to the<br />
decrease in property crimes, which c<strong>on</strong>stitute the vast bulk<br />
of crimes and are more likely to be reported in industrialized<br />
countries vis-à-vis developing <strong>on</strong>es.<br />
Nati<strong>on</strong>al crime c<strong>on</strong>diti<strong>on</strong>s and trends<br />
Latin America<br />
and the Caribbean<br />
When various types of crimes for all income groups are<br />
aggregated cross-nati<strong>on</strong>ally, the sums are staggering. For<br />
example, there were almost 50 milli<strong>on</strong> property and violent<br />
crimes recorded by police in 34 industrialized and industrializing<br />
countries in 2001 al<strong>on</strong>e. 24 These nati<strong>on</strong>s account for<br />
less than <strong>on</strong>e fifth of the world’s populati<strong>on</strong> according to<br />
2006 estimates, 25 which makes the numbers even more<br />
compelling when it is c<strong>on</strong>sidered that many crimes are not<br />
reported. Moreover, crime statistics routinely undercount<br />
poor victims and those from marginalized communities,<br />
where crime is likely to be more pervasive. Large nati<strong>on</strong>s<br />
such as the US, Russia and the UK c<strong>on</strong>sistently account for a<br />
major share of crime incidents, although their rates have<br />
varied c<strong>on</strong>siderably within each country over the past<br />
decade. Moreover, crime rates differ significantly between<br />
countries and are not always explained by sheer populati<strong>on</strong><br />
size. For example, based <strong>on</strong> 2001 data, the US had about six<br />
times the crime rate of Cyprus (3658 crimes per 100,000<br />
versus 595 crimes per 100,000 individuals), but 383 times<br />
Counts and rates<br />
decreased<br />
10 (19%)<br />
Counts increased<br />
but rates decreased<br />
4 (8%)<br />
Counts and rates<br />
increased<br />
38 (73%)<br />
Figure 3.1<br />
Total recorded crime<br />
trends per 100,000<br />
individuals in selected<br />
regi<strong>on</strong>s of the world<br />
Source: Shaw et al, 2003, p42<br />
Crime statistics<br />
routinely<br />
undercount poor<br />
victims and those<br />
from marginalized<br />
communities, where<br />
crime is likely to be<br />
more pervasive<br />
Figure 3.2<br />
Police-recorded crimes<br />
and attempts for 52<br />
countries: Changes in<br />
counts and rates<br />
(2001–2002) 26<br />
Source: Adapted from<br />
UNODC, 2005a, Table 2.1