Global Report on Human Settlements 2007 - PoA-ISS
Global Report on Human Settlements 2007 - PoA-ISS
Global Report on Human Settlements 2007 - PoA-ISS

You also want an ePaper? Increase the reach of your titles
YUMPU automatically turns print PDFs into web optimized ePapers that Google loves.
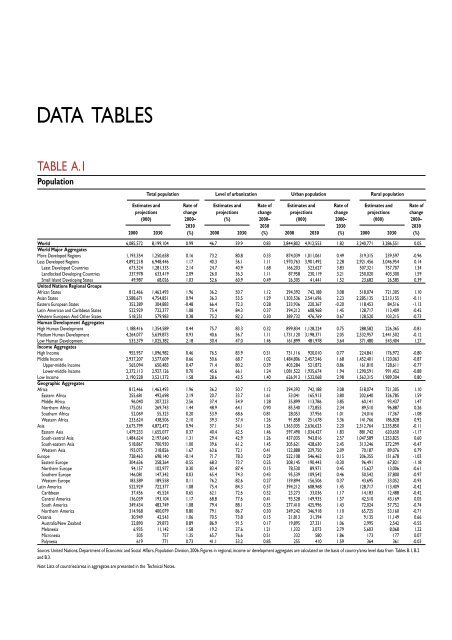
DATA TABLES<br />
TABLE A.1<br />
Populati<strong>on</strong><br />
Total populati<strong>on</strong> Level of urbanizati<strong>on</strong> Urban populati<strong>on</strong> Rural populati<strong>on</strong><br />
Estimates and Rate of Estimates and Rate of Estimates and Rate of Estimates and Rate of<br />
projecti<strong>on</strong>s change projecti<strong>on</strong>s change projecti<strong>on</strong>s change projecti<strong>on</strong>s change<br />
(000) 2000– (%) 2000– (000) 2000– (000) 2000–<br />
2030 2030 2030 2030<br />
2000 2030 (%) 2000 2030 (%) 2000 2030 (%) 2000 2030 (%)<br />
World 6,085,572 8,199,104 0.99 46.7 59.9 0.83 2,844,802 4,912,553 1.82 3,240,771 3,286,551 0.05<br />
World Major Aggregates<br />
More Developed Regi<strong>on</strong>s 1,193,354 1,250,658 0.16 73.2 80.8 0.33 874,039 1,011,061 0.49 319,315 239,597 -0.96<br />
Less Developed Regi<strong>on</strong>s 4,892,218 6,948,446 1.17 40.3 56.1 1.11 1,970,763 3,901,492 2.28 2,921,456 3,046,954 0.14<br />
Least Developed Countries 673,524 1,281,335 2.14 24.7 40.9 1.68 166,203 523,627 3.83 507,321 757,707 1.34<br />
Landlocked Developing Countries 337,978 633,419 2.09 26.0 36.3 1.11 87,958 230,119 3.21 250,020 403,300 1.59<br />
Small Island Developing States 49,987 68,026 1.03 52.6 60.9 0.49 26,305 41,441 1.52 23,682 26,585 0.39<br />
United Nati<strong>on</strong>s Regi<strong>on</strong>al Groups<br />
African States 812,466 1,463,493 1.96 36.2 50.7 1.12 294,392 742,188 3.08 518,074 721,305 1.10<br />
Asian States 3,588,671 4,754,851 0.94 36.3 53.5 1.29 1,303,536 2,541,696 2.23 2,285,135 2,213,155 -0.11<br />
Eastern European States 352,389 304,883 -0.48 66.4 72.3 0.28 233,936 220,367 -0.20 118,453 84,516 -1.13<br />
Latin American and Caribbean States 522,929 722,377 1.08 75.4 84.3 0.37 394,212 608,968 1.45 128,717 113,409 -0.42<br />
Western European And Other States 518,251 579,983 0.38 75.2 82.2 0.30 389,732 476,769 0.67 128,520 103,215 -0.73<br />
<strong>Human</strong> Development Aggregates<br />
High <strong>Human</strong> Development 1,188,416 1,354,589 0.44 75.7 83.3 0.32 899,834 1,128,224 0.75 288,582 226,365 -0.81<br />
Medium <strong>Human</strong> Development 4,264,077 5,639,873 0.93 40.6 56.7 1.11 1,731,120 3,198,371 2.05 2,532,957 2,441,502 -0.12<br />
Low <strong>Human</strong> Development 533,379 1,025,382 2.18 30.4 47.0 1.46 161,899 481,978 3.64 371,480 543,404 1.27<br />
Income Aggregates<br />
High Income 955,957 1,096,982 0.46 76.5 83.9 0.31 731,116 920,010 0.77 224,841 176,972 -0.80<br />
Middle Income 2,937,207 3,577,609 0.66 50.6 68.7 1.02 1,484,806 2,457,546 1.68 1,452,401 1,120,063 -0.87<br />
Upper-middle Income 565,094 650,483 0.47 71.4 80.2 0.39 403,284 521,872 0.86 161,810 128,611 -0.77<br />
Lower-middle Income 2,372,113 2,927,126 0.70 45.6 66.1 1.24 1,081,522 1,935,674 1.94 1,290,591 991,452 -0.88<br />
Low Income 2,190,228 3,521,372 1.58 28.6 43.5 1.40 626,913 1,532,068 2.98 1,563,315 1,989,304 0.80<br />
Geographic Aggregates<br />
Africa 812,466 1,463,493 1.96 36.2 50.7 1.12 294,392 742,188 3.08 518,074 721,305 1.10<br />
Eastern Africa 255,681 492,698 2.19 20.7 33.7 1.61 53,041 165,913 3.80 202,640 326,785 1.59<br />
Middle Africa 96,040 207,223 2.56 37.4 54.9 1.28 35,899 113,786 3.85 60,141 93,437 1.47<br />
Northern Africa 175,051 269,743 1.44 48.9 64.1 0.90 85,540 172,855 2.34 89,510 96,887 0.26<br />
Southern Africa 52,069 55,323 0.20 53.9 68.6 0.81 28,053 37,956 1.01 24,016 17,367 -1.08<br />
Western Africa 233,624 438,506 2.10 39.3 57.4 1.26 91,858 251,678 3.36 141,766 186,828 0.92<br />
Asia 3,675,799 4,872,472 0.94 37.1 54.1 1.26 1,363,035 2,636,623 2.20 2,312,764 2,235,850 -0.11<br />
Eastern Asia 1,479,233 1,655,077 0.37 40.4 62.5 1.46 597,490 1,034,427 1.83 881,742 620,650 -1.17<br />
South-central Asia 1,484,624 2,197,640 1.31 29.4 42.9 1.26 437,035 943,816 2.57 1,047,589 1,253,825 0.60<br />
South-eastern Asia 518,867 700,930 1.00 39.6 61.2 1.45 205,621 428,630 2.45 313,246 272,299 -0.47<br />
Western Asia 193,075 318,826 1.67 63.6 72.1 0.41 122,888 229,750 2.09 70,187 89,076 0.79<br />
Europe 728,463 698,140 -0.14 71.7 78.3 0.29 522,108 546,462 0.15 206,355 151,678 -1.03<br />
Eastern Europe 304,636 258,264 -0.55 68.3 73.7 0.25 208,145 190,443 -0.30 96,491 67,821 -1.18<br />
Northern Europe 94,157 102,977 0.30 83.4 87.4 0.15 78,530 89,971 0.45 15,627 13,006 -0.61<br />
Southern Europe 146,081 147,342 0.03 65.4 74.3 0.43 95,539 109,542 0.46 50,542 37,800 -0.97<br />
Western Europe 183,589 189,558 0.11 76.2 82.6 0.27 139,894 156,506 0.37 43,695 33,052 -0.93<br />
Latin America 522,929 722,377 1.08 75.4 84.3 0.37 394,212 608,968 1.45 128,717 113,409 -0.42<br />
Caribbean 37,456 45,524 0.65 62.1 72.6 0.52 23,273 33,036 1.17 14,183 12,488 -0.42<br />
Central America 136,039 193,104 1.17 68.8 77.6 0.41 93,528 149,935 1.57 42,510 43,169 0.05<br />
South America 349,434 483,749 1.08 79.4 88.1 0.35 277,410 425,996 1.43 72,024 57,752 -0.74<br />
Northern America 314,968 400,079 0.80 79.1 86.7 0.30 249,242 346,918 1.10 65,725 53,160 -0.71<br />
Oceania 30,949 42,543 1.06 70.5 73.8 0.15 21,813 31,394 1.21 9,135 11,149 0.66<br />
Australia/New Zealand 22,890 29,873 0.89 86.9 91.5 0.17 19,895 27,331 1.06 2,995 2,542 -0.55<br />
Melanesia 6,935 11,142 1.58 19.2 27.6 1.21 1,332 3,073 2.79 5,603 8,068 1.22<br />
Micr<strong>on</strong>esia 505 757 1.35 65.7 76.6 0.51 332 580 1.86 173 177 0.07<br />
Polynesia 619 771 0.73 41.1 53.2 0.85 255 410 1.59 364 361 -0.03<br />
Sources: United Nati<strong>on</strong>s, Department of Ec<strong>on</strong>omic and Social Affairs, Populati<strong>on</strong> Divisi<strong>on</strong>, 2006. Figures in regi<strong>on</strong>al, income or development aggregates are calculated <strong>on</strong> the basis of country/area level data from Tables B.1, B.2<br />
and B.3.<br />
Note: Lists of countries/areas in aggregates are presented in the Technical Notes.