Global Report on Human Settlements 2007 - PoA-ISS
Global Report on Human Settlements 2007 - PoA-ISS
Global Report on Human Settlements 2007 - PoA-ISS

Create successful ePaper yourself
Turn your PDF publications into a flip-book with our unique Google optimized e-Paper software.
190<br />
Natural and human-made disasters<br />
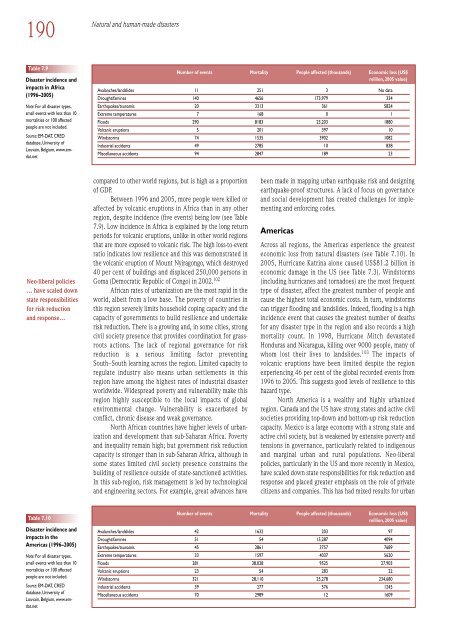
Table 7.9<br />
Disaster incidence and<br />
impacts in Africa<br />
(1996–2005)<br />
Note: For all disaster types,<br />
small events with less than 10<br />
mortalities or 100 affected<br />
people are not included.<br />
Source: EM-DAT, CRED<br />
database, University of<br />
Louvain, Belgium, www.emdat.net<br />
Number of events Mortality People affected (thousands) Ec<strong>on</strong>omic loss (US$<br />
milli<strong>on</strong>, 2005 value)<br />
Avalanches/landslides 11 251 3 No data<br />
Drought/famines 140 4656 173,979 334<br />
Earthquakes/tsunamis 20 3313 361 5824<br />
Extreme temperatures 7 168 0 1<br />
Floods 290 8183 23,203 1880<br />
Volcanic erupti<strong>on</strong>s 5 201 397 10<br />
Windstorms 74 1535 3902 1082<br />
Industrial accidents 49 2785 10 838<br />
Miscellaneous accidents 94 2847 189 23<br />
Neo-liberal policies<br />
… have scaled down<br />
state resp<strong>on</strong>sibilities<br />
for risk reducti<strong>on</strong><br />
and resp<strong>on</strong>se…<br />
compared to other world regi<strong>on</strong>s, but is high as a proporti<strong>on</strong><br />
of GDP.<br />
Between 1996 and 2005, more people were killed or<br />
affected by volcanic erupti<strong>on</strong>s in Africa than in any other<br />
regi<strong>on</strong>, despite incidence (five events) being low (see Table<br />
7.9). Low incidence in Africa is explained by the l<strong>on</strong>g return<br />
periods for volcanic erupti<strong>on</strong>s, unlike in other world regi<strong>on</strong>s<br />
that are more exposed to volcanic risk. The high loss-to-event<br />
ratio indicates low resilience and this was dem<strong>on</strong>strated in<br />
the volcanic erupti<strong>on</strong> of Mount Nyirag<strong>on</strong>go, which destroyed<br />
40 per cent of buildings and displaced 250,000 pers<strong>on</strong>s in<br />
Goma (Democratic Republic of C<strong>on</strong>go) in 2002. 102<br />
African rates of urbanizati<strong>on</strong> are the most rapid in the<br />
world, albeit from a low base. The poverty of countries in<br />
this regi<strong>on</strong> severely limits household coping capacity and the<br />
capacity of governments to build resilience and undertake<br />
risk reducti<strong>on</strong>. There is a growing and, in some cities, str<strong>on</strong>g<br />
civil society presence that provides coordinati<strong>on</strong> for grassroots<br />
acti<strong>on</strong>s. The lack of regi<strong>on</strong>al governance for risk<br />
reducti<strong>on</strong> is a serious limiting factor preventing<br />
South–South learning across the regi<strong>on</strong>. Limited capacity to<br />
regulate industry also means urban settlements in this<br />
regi<strong>on</strong> have am<strong>on</strong>g the highest rates of industrial disaster<br />
worldwide. Widespread poverty and vulnerability make this<br />
regi<strong>on</strong> highly susceptible to the local impacts of global<br />
envir<strong>on</strong>mental change. Vulnerability is exacerbated by<br />
c<strong>on</strong>flict, chr<strong>on</strong>ic disease and weak governance.<br />
North African countries have higher levels of urbanizati<strong>on</strong><br />
and development than sub-Saharan Africa. Poverty<br />
and inequality remain high; but government risk reducti<strong>on</strong><br />
capacity is str<strong>on</strong>ger than in sub-Saharan Africa, although in<br />
some states limited civil society presence c<strong>on</strong>strains the<br />
building of resilience outside of state-sancti<strong>on</strong>ed activities.<br />
In this sub-regi<strong>on</strong>, risk management is led by technological<br />
and engineering sectors. For example, great advances have<br />
been made in mapping urban earthquake risk and designing<br />
earthquake-proof structures. A lack of focus <strong>on</strong> governance<br />
and social development has created challenges for implementing<br />
and enforcing codes.<br />
Americas<br />
Across all regi<strong>on</strong>s, the Americas experience the greatest<br />
ec<strong>on</strong>omic loss from natural disasters (see Table 7.10). In<br />
2005, Hurricane Katrina al<strong>on</strong>e caused US$81.2 billi<strong>on</strong> in<br />
ec<strong>on</strong>omic damage in the US (see Table 7.3). Windstorms<br />
(including hurricanes and tornadoes) are the most frequent<br />
type of disaster, affect the greatest number of people and<br />
cause the highest total ec<strong>on</strong>omic costs. In turn, windstorms<br />
can trigger flooding and landslides. Indeed, flooding is a high<br />
incidence event that causes the greatest number of deaths<br />
for any disaster type in the regi<strong>on</strong> and also records a high<br />
mortality count. In 1998, Hurricane Mitch devastated<br />
H<strong>on</strong>duras and Nicaragua, killing over 9000 people, many of<br />
whom lost their lives to landslides. 103 The impacts of<br />
volcanic erupti<strong>on</strong>s have been limited despite the regi<strong>on</strong><br />
experiencing 46 per cent of the global recorded events from<br />
1996 to 2005. This suggests good levels of resilience to this<br />
hazard type.<br />
North America is a wealthy and highly urbanized<br />
regi<strong>on</strong>. Canada and the US have str<strong>on</strong>g states and active civil<br />
societies providing top-down and bottom-up risk reducti<strong>on</strong><br />
capacity. Mexico is a large ec<strong>on</strong>omy with a str<strong>on</strong>g state and<br />
active civil society, but is weakened by extensive poverty and<br />
tensi<strong>on</strong>s in governance, particularly related to indigenous<br />
and marginal urban and rural populati<strong>on</strong>s. Neo-liberal<br />
policies, particularly in the US and more recently in Mexico,<br />
have scaled down state resp<strong>on</strong>sibilities for risk reducti<strong>on</strong> and<br />
resp<strong>on</strong>se and placed greater emphasis <strong>on</strong> the role of private<br />
citizens and companies. This has had mixed results for urban<br />
Table 7.10<br />
Disaster incidence and<br />
impacts in the<br />
Americas (1996–2005)<br />
Note: For all disaster types,<br />
small events with less than 10<br />
mortalities or 100 affected<br />
people are not included.<br />
Source: EM-DAT, CRED<br />
database, University of<br />
Louvain, Belgium, www.emdat.net<br />
Number of events Mortality People affected (thousands) Ec<strong>on</strong>omic loss (US$<br />
milli<strong>on</strong>, 2005 value)<br />
Avalanches/landslides 42 1632 203 97<br />
Drought/famines 51 54 15,287 4094<br />
Earthquakes/tsunamis 45 2861 3757 7689<br />
Extreme temperatures 33 1597 4037 5620<br />
Floods 281 38,028 9525 27,903<br />
Volcanic erupti<strong>on</strong>s 23 54 283 22<br />
Windstorms 321 28,110 25,278 234,680<br />
Industrial accidents 39 277 576 1245<br />
Miscellaneous accidents 70 2989 12 1609