- Page 1 and 2:
Exploring Unknown the Selected Docu
- Page 3 and 4:
I-11 President John F. Kennedy to H
- Page 5 and 6:
II-2 S.M. Greenfield and W.W. Kello
- Page 7 and 8:
II-23 Arnold W. Frutkin, Memorandum
- Page 9 and 10:
II-46-II-48 Gregory W. Withee, Acti
- Page 11 and 12:
III-18 “Space Commercialization M
- Page 13 and 14:
Acknowledgments This volume is the
- Page 15 and 16:
Introduction One of the most import
- Page 17 and 18:
The editorial method we adopted for
- Page 19 and 20:
Joseph N. Pelton is a professor of
- Page 21 and 22:
GAO . . . . . . . . . . . . . . . .
- Page 23 and 24:
Chapter One The History of Satellit
- Page 25 and 26:
EXPLORING THE UNKNOWN 3 satellite f
- Page 27 and 28:
EXPLORING THE UNKNOWN 5 different v
- Page 29 and 30:
EXPLORING THE UNKNOWN 7 satellite s
- Page 31 and 32:
EXPLORING THE UNKNOWN 9 This unique
- Page 33 and 34:
EXPLORING THE UNKNOWN 11 technology
- Page 35 and 36:
EXPLORING THE UNKNOWN 13 7. In the
- Page 37 and 38:
EXPLORING THE UNKNOWN 15 16. The re
- Page 39 and 40:
applies only to the closest possibl
- Page 41 and 42:
EXPLORING THE UNKNOWN 19 arrangemen
- Page 43 and 44:
EXPLORING THE UNKNOWN 21 Conclusion
- Page 45 and 46:
entific and engineering work and to
- Page 47 and 48:
observations indicated strong refle
- Page 49 and 50:
EXPLORING THE UNKNOWN 27 Oval-shape
- Page 51 and 52:
Number of Randomly Spaced Satellite
- Page 53 and 54:
Document I-4 Document Title: Memora
- Page 55 and 56:
EXPLORING THE UNKNOWN 33 6. How can
- Page 57 and 58:
EXPLORING THE UNKNOWN 35 RECOMMENDA
- Page 59 and 60:
[3] 2. SUMMARY OF TECHNICAL FEATURE
- Page 61 and 62:
[28] 7. CONCLUSIONS AND RECOMMENDAT
- Page 63 and 64:
EXPLORING THE UNKNOWN 41 d. NASA’
- Page 65 and 66:
EXPLORING THE UNKNOWN 43 [1] PUBLIC
- Page 67 and 68:
EXPERIMENTATION The Commission is e
- Page 69 and 70:
EXPLORING THE UNKNOWN 47 During dis
- Page 71 and 72:
facilities in intercontinental comm
- Page 73 and 74:
Ground Transmitting Station at Holm
- Page 75 and 76:
EXPLORING THE UNKNOWN 53 diodes, so
- Page 77 and 78:
EXPLORING THE UNKNOWN 55 Bell Telep
- Page 79 and 80:
EXPLORING THE UNKNOWN 57 Our estima
- Page 81 and 82:
EXPLORING THE UNKNOWN 59 implicatio
- Page 83 and 84:
EXPLORING THE UNKNOWN 61 as quickly
- Page 85 and 86:
EXPLORING THE UNKNOWN 63 Commission
- Page 87 and 88:
EXPLORING THE UNKNOWN 65 Document t
- Page 89 and 90:
EXPLORING THE UNKNOWN 67 licenses,
- Page 91 and 92:
EXPLORING THE UNKNOWN 69 opment of
- Page 93 and 94:
EXPLORING THE UNKNOWN 71 any system
- Page 95 and 96:
In the end, the administration bill
- Page 97 and 98:
EXPLORING THE UNKNOWN 75 program in
- Page 99 and 100:
your bill and some of the major asp
- Page 101 and 102:
EXPLORING THE UNKNOWN 79 1934, as a
- Page 103 and 104:
EXPLORING THE UNKNOWN 81 or appropr
- Page 105 and 106:
U.S.C. 310) [citation in margin:
- Page 107 and 108:
interest; and (iii) an evaluation o
- Page 109 and 110:
EXPLORING THE UNKNOWN 87 ment on Ap
- Page 111 and 112:
EXPLORING THE UNKNOWN 89 aspects of
- Page 113 and 114:
Document title: Memorandum from J.
- Page 115 and 116:
EXPLORING THE UNKNOWN 93 tiated by
- Page 117 and 118:
cations satellite system rather tha
- Page 119 and 120:
___________________________________
- Page 121 and 122:
telegram are as follows: (A) Policy
- Page 123 and 124:
tems. Diversion of Government traff
- Page 125 and 126:
quality of services and charges for
- Page 127 and 128:
EXPLORING THE UNKNOWN 105 tions is
- Page 129 and 130:
EXPLORING THE UNKNOWN 107 A. Techno
- Page 131 and 132:
Report of the United States Delegat
- Page 133 and 134:
States, Vatican City State, Venezue
- Page 135 and 136:
EXPLORING THE UNKNOWN 113 structure
- Page 137 and 138:
EXPLORING THE UNKNOWN 115 U.S. posi
- Page 139 and 140:
EXPLORING THE UNKNOWN 117 agreed th
- Page 141 and 142:
EXPLORING THE UNKNOWN 119 VII. Futu
- Page 143 and 144:
EXPLORING THE UNKNOWN 121 to explor
- Page 145 and 146:
EXPLORING THE UNKNOWN 123 (b) to af
- Page 147 and 148:
EXPLORING THE UNKNOWN 125 the natio
- Page 149 and 150:
EXPLORING THE UNKNOWN 127 and Order
- Page 151 and 152:
EXPLORING THE UNKNOWN 129 own stron
- Page 153 and 154:
EXPLORING THE UNKNOWN 131 We are en
- Page 155 and 156:
EXPLORING THE UNKNOWN 133 and meeti
- Page 157 and 158:
EXPLORING THE UNKNOWN 135 Plumbrook
- Page 159 and 160:
cant background information and wor
- Page 161 and 162:
EXPLORING THE UNKNOWN 139 Applicati
- Page 163 and 164:
earth terminals, high-gain satellit
- Page 165 and 166:
20 watts of power per kilogram. New
- Page 167 and 168:
EXPLORING THE UNKNOWN 145 the devel
- Page 169 and 170:
No additional items were reviewed.
- Page 171 and 172:
Specifically, this report concludes
- Page 173 and 174:
[55] THE SECRETARY OF COMMERCE Wash
- Page 175 and 176:
A memorandum of law concerning Arti
- Page 177 and 178:
156 OBSERVING THE EARTH FROM SPACE
- Page 179 and 180:
158 OBSERVING THE EARTH FROM SPACE
- Page 181 and 182:
160 OBSERVING THE EARTH FROM SPACE
- Page 183 and 184:
162 OBSERVING THE EARTH FROM SPACE
- Page 185 and 186:
164 OBSERVING THE EARTH FROM SPACE
- Page 187 and 188:
166 OBSERVING THE EARTH FROM SPACE
- Page 189 and 190:
168 OBSERVING THE EARTH FROM SPACE
- Page 191 and 192:
170 OBSERVING THE EARTH FROM SPACE
- Page 193 and 194:
172 OBSERVING THE EARTH FROM SPACE
- Page 195 and 196:
174 OBSERVING THE EARTH FROM SPACE
- Page 197 and 198:
176 OBSERVING THE EARTH FROM SPACE
- Page 199 and 200:
178 OBSERVING THE EARTH FROM SPACE
- Page 201 and 202:
180 OBSERVING THE EARTH FROM SPACE
- Page 203 and 204:
182 OBSERVING THE EARTH FROM SPACE
- Page 205 and 206:
184 OBSERVING THE EARTH FROM SPACE
- Page 207 and 208:
186 OBSERVING THE EARTH FROM SPACE
- Page 209 and 210:
188 OBSERVING THE EARTH FROM SPACE
- Page 211 and 212:
190 OBSERVING THE EARTH FROM SPACE
- Page 213 and 214:
192 OBSERVING THE EARTH FROM SPACE
- Page 215 and 216:
194 OBSERVING THE EARTH FROM SPACE
- Page 217 and 218:
196 scanned from extreme altitudes
- Page 219 and 220:
198 winds, cumulus clouds that have
- Page 221 and 222:
200 bends back on itself with incre
- Page 223 and 224:
202 OBSERVING THE EARTH FROM SPACE
- Page 225 and 226:
204 required for Project TIROS in e
- Page 227 and 228:
206 OBSERVING THE EARTH FROM SPACE
- Page 229 and 230:
208 OBSERVING THE EARTH FROM SPACE
- Page 231 and 232:
210 OBSERVING THE EARTH FROM SPACE
- Page 233 and 234:
212 [1] [rubber stamped: “AUG 15
- Page 235 and 236:
214 These two letters, one from Con
- Page 237 and 238:
216 OBSERVING THE EARTH FROM SPACE
- Page 239 and 240:
218 OBSERVING THE EARTH FROM SPACE
- Page 241 and 242:
220 Budget Authority (BA) and Outla
- Page 243 and 244:
222 OBSERVING THE EARTH FROM SPACE
- Page 245 and 246:
224 Document II-11 Document title:
- Page 247 and 248:
226 OBSERVING THE EARTH FROM SPACE
- Page 249 and 250:
228 OBSERVING THE EARTH FROM SPACE
- Page 251 and 252:
230 OBSERVING THE EARTH FROM SPACE
- Page 253 and 254:
232 International Applications Area
- Page 255 and 256:
234 OBSERVING THE EARTH FROM SPACE
- Page 257 and 258:
236 Agricultural Geographic Geologi
- Page 259 and 260:
238 OBSERVING THE EARTH FROM SPACE
- Page 261 and 262:
240 that a number of important user
- Page 263 and 264:
242 [1] For the Record SAR/Robert G
- Page 265 and 266:
244 make every effort to ensure tha
- Page 267 and 268:
246 monitor the earth’s volcanoes
- Page 269 and 270:
248 OBSERVING THE EARTH FROM SPACE
- Page 271 and 272:
250 with us in this area). Encourag
- Page 273 and 274:
252 OBSERVING THE EARTH FROM SPACE
- Page 275 and 276:
254 the memorandum be explicitly br
- Page 277 and 278:
256 should officially participate i
- Page 279 and 280:
258 [1] APR 14, 1970 Honorable Walt
- Page 281 and 282:
260 One persuasive argument for cre
- Page 283 and 284:
262 General Assembly’s First Comm
- Page 285 and 286:
264 [1] July 24, 1974 Summary OBSER
- Page 287 and 288:
266 OBSERVING THE EARTH FROM SPACE
- Page 289 and 290:
268 OBSERVING THE EARTH FROM SPACE
- Page 291 and 292:
270 in the months following the lau
- Page 293 and 294:
272 Document II-26 Document title:
- Page 295 and 296:
274 their goals by making improved
- Page 297 and 298:
276 OBSERVING THE EARTH FROM SPACE
- Page 299 and 300:
278 recommended that continuity of
- Page 301 and 302:
280 gap in data availability would
- Page 303 and 304:
282 ment—considering the budgetar
- Page 305 and 306:
284 vices required for a multipurpo
- Page 307 and 308:
286 and for maintaining archives of
- Page 309 and 310:
288 OBSERVING THE EARTH FROM SPACE
- Page 311 and 312:
290 OBSERVING THE EARTH FROM SPACE
- Page 313 and 314:
292 D. Conclusions and Consequences
- Page 315 and 316:
294 Document II-31 Document title:
- Page 317 and 318:
296 OBSERVING THE EARTH FROM SPACE
- Page 319 and 320:
298 Assumptions This document was d
- Page 321 and 322:
300 OBSERVING THE EARTH FROM SPACE
- Page 323 and 324:
302 OBSERVING THE EARTH FROM SPACE
- Page 325 and 326:
304 training and technology transfe
- Page 327 and 328:
306 the payment of appropriate fees
- Page 329 and 330:
308 • The sub-issues that will ne
- Page 331 and 332:
310 OBSERVING THE EARTH FROM SPACE
- Page 333 and 334:
312 OBSERVING THE EARTH FROM SPACE
- Page 335 and 336:
314 development, either alone or in
- Page 337 and 338:
316 rity and foreign policy implica
- Page 339 and 340:
318 OBSERVING THE EARTH FROM SPACE
- Page 341 and 342:
320 report or explicitly address th
- Page 343 and 344:
322 OBSERVING THE EARTH FROM SPACE
- Page 345 and 346:
324 OBSERVING THE EARTH FROM SPACE
- Page 347 and 348:
326 OBSERVING THE EARTH FROM SPACE
- Page 349 and 350:
328 OBSERVING THE EARTH FROM SPACE
- Page 351 and 352:
330 [no pagination] PUBLIC LAW 98-3
- Page 353 and 354:
332 OBSERVING THE EARTH FROM SPACE
- Page 355 and 356:
334 OBSERVING THE EARTH FROM SPACE
- Page 357 and 358:
336 OBSERVING THE EARTH FROM SPACE
- Page 359 and 360:
338 OBSERVING THE EARTH FROM SPACE
- Page 361 and 362:
340 OBSERVING THE EARTH FROM SPACE
- Page 363 and 364:
342 OBSERVING THE EARTH FROM SPACE
- Page 365 and 366:
344 AUTHORIZATION OF APPROPRIATIONS
- Page 367 and 368:
346 [no pagination] For Immediate R
- Page 369 and 370:
348 This management plan spells out
- Page 371 and 372:
350 funding adjustments as agreed t
- Page 373 and 374:
352 Includes: • Ground System Dev
- Page 375 and 376:
354 OBSERVING THE EARTH FROM SPACE
- Page 377 and 378:
356 OBSERVING THE EARTH FROM SPACE
- Page 379 and 380:
358 OBSERVING THE EARTH FROM SPACE
- Page 381 and 382:
360 OBSERVING THE EARTH FROM SPACE
- Page 383 and 384:
362 OBSERVING THE EARTH FROM SPACE
- Page 385 and 386:
364 OBSERVING THE EARTH FROM SPACE
- Page 387 and 388:
366 OBSERVING THE EARTH FROM SPACE
- Page 389 and 390:
368 TITLE VI—PROHIBITION OF COMME
- Page 391 and 392:
370 Document II-42 Honorable George
- Page 393 and 394:
372 The Honorable John H. Gibbons A
- Page 395 and 396:
374 (b) Make government-owned Lands
- Page 397 and 398:
376 The letter from NOAA’s Gregor
- Page 399 and 400:
378 There is currently considerable
- Page 401 and 402:
380 7. During periods when national
- Page 403 and 404:
382 OBSERVING THE EARTH FROM SPACE
- Page 405 and 406:
Chapter Three Space as an Investmen
- Page 407 and 408:
EXPLORING THE UNKNOWN 387 However,
- Page 409 and 410:
EXPLORING THE UNKNOWN 389 sectors o
- Page 411 and 412:
EXPLORING THE UNKNOWN 391 the devel
- Page 413 and 414:
EXPLORING THE UNKNOWN 393 during th
- Page 415 and 416:
EXPLORING THE UNKNOWN 395 Internati
- Page 417 and 418:
EXPLORING THE UNKNOWN 397 Committee
- Page 419 and 420:
EXPLORING THE UNKNOWN 399 are not s
- Page 421 and 422:
still many hurdles for the space in
- Page 423 and 424:
[1] SUMMARY AND CONCLUSIONS EXPLORI
- Page 425 and 426:
EXPLORING THE UNKNOWN 405 developme
- Page 427 and 428:
important role in raising funds for
- Page 429 and 430:
nomic growth. The focus was on aggr
- Page 431 and 432:
the quality of goods and services d
- Page 433 and 434:
findings indicated that most of the
- Page 435 and 436:
This study showed an overall seven-
- Page 437 and 438:
sible to forecast the impacts on ma
- Page 439 and 440:
Our formulation of γ is as follows
- Page 441 and 442:
EXPLORING THE UNKNOWN 421 Table 4 I
- Page 443 and 444:
already shown above (Table 5) the m
- Page 445 and 446:
Significance of Findings Significan
- Page 447 and 448:
David Cross and I will be glad to d
- Page 449 and 450:
EXPLORING THE UNKNOWN 429 • The d
- Page 451 and 452:
EXPLORING THE UNKNOWN 431 [i] NASA
- Page 453 and 454:
EXPLORING THE UNKNOWN 433 The major
- Page 455 and 456:
their momentous insight when they d
- Page 457 and 458:
The direct social impact of NASA co
- Page 459 and 460:
[32] Microwave Systems Internal Gas
- Page 461 and 462:
[34] Internal Gas Dynamics Telemetr
- Page 463 and 464:
Impact of NASA Combinations High Mo
- Page 465 and 466:
Percentage of Economic Impact Alrea
- Page 467 and 468:
“less” to a “more” preferre
- Page 469 and 470:
[8] 4. NASTRAN NASTRAN (NASA Struct
- Page 471 and 472:
The following sections will discuss
- Page 473 and 474:
Diff. From Baseline, Thousands Figu
- Page 475 and 476:
EXPLORING THE UNKNOWN 455 expenditu
- Page 477 and 478:
[2] II. CREATING OPPORTUNITIES FOR
- Page 479 and 480:
10. Private Launch Ranges: The Admi
- Page 481 and 482:
products and services to the avoida
- Page 483 and 484:
— With respect to technologies ge
- Page 485 and 486:
EXPLORING THE UNKNOWN 465 presence
- Page 487 and 488:
EXPLORING THE UNKNOWN 467 (c) DoD,
- Page 489 and 490:
(4) To stimulate private sector inv
- Page 491 and 492:
EXPLORING THE UNKNOWN 471 (iii)Supp
- Page 493 and 494:
develop design guidelines for futur
- Page 495 and 496:
B. SATELLITE COMMUNICATIONS Satelli
- Page 497 and 498:
Tended Facilities (MTFs) each offer
- Page 499 and 500:
amount of R&D activity which can be
- Page 501 and 502:
Long-Term Prospects for Development
- Page 503 and 504:
[261] Environment: 1) Monitoring po
- Page 505 and 506:
EXPLORING THE UNKNOWN 485 ly possib
- Page 507 and 508:
In many religions the wealth of the
- Page 509 and 510:
EXPLORING THE UNKNOWN 489 [no pagin
- Page 511 and 512:
EXPLORING THE UNKNOWN 491 The follo
- Page 513 and 514:
EXPLORING THE UNKNOWN 493 commercia
- Page 515 and 516:
EXPLORING THE UNKNOWN 495 The first
- Page 517 and 518:
EXPLORING THE UNKNOWN 497 tion was
- Page 519 and 520:
August 3, 1983 Space Commercializat
- Page 521 and 522:
EXPLORING THE UNKNOWN 501 Outline o
- Page 523 and 524:
EXPLORING THE UNKNOWN 503 space ind
- Page 525 and 526:
EXPLORING THE UNKNOWN 505 guide, di
- Page 527 and 528: of a dollar of profit from future o
- Page 529 and 530: Return on Investment*—$M 50 40 30
- Page 531 and 532: the desired average expected return
- Page 533 and 534: Patents Trade Secrets Liabilities I
- Page 535 and 536: Risk Adjusted Return on Investment
- Page 537 and 538: EXPLORING THE UNKNOWN 517 Implement
- Page 539 and 540: As they look to the turn of the cen
- Page 541 and 542: Exports (Dollar Per Capita) $500 $4
- Page 543 and 544: Supply (Years) Rate of Increase 200
- Page 545 and 546: EXPLORING THE UNKNOWN 525 Table 1.
- Page 547 and 548: Investment Cost Per Satellite Voice
- Page 549 and 550: EXPLORING THE UNKNOWN 529 (4) Altho
- Page 551 and 552: For five of the thirty-two the terr
- Page 553 and 554: Projected Annual and Cumulative Rev
- Page 555 and 556: EXPLORING THE UNKNOWN 535 growth, a
- Page 557 and 558: EXPLORING THE UNKNOWN 537 that firm
- Page 559 and 560: this study could exercise the syste
- Page 561 and 562: Our recent work with live cell mate
- Page 563 and 564: [no page number] Annual Gross Sales
- Page 565 and 566: to ensure that its accounting syste
- Page 567 and 568: Proposal for Enhancing NASA Technol
- Page 569 and 570: e) A Special Mission Development Di
- Page 571 and 572: “NASA Social Impact,” I have su
- Page 573 and 574: flow of technology information to s
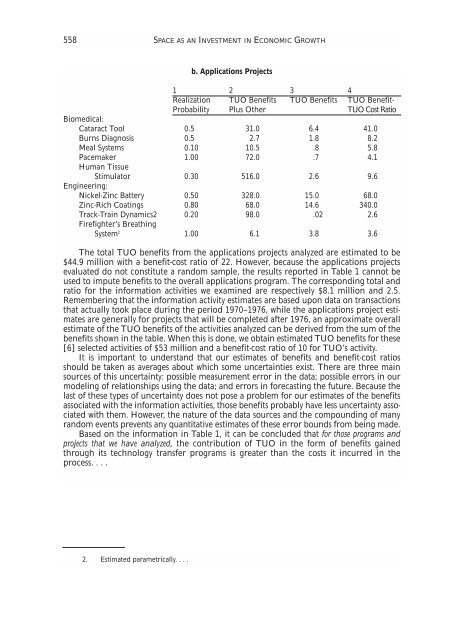
- Page 575 and 576: 1976. This figure includes net bene
- Page 577: EXPLORING THE UNKNOWN 557 It is imp
- Page 581 and 582: EXPLORING THE UNKNOWN 561 earlier b
- Page 583 and 584: Finally, the medical end use catego
- Page 585 and 586: EXPLORING THE UNKNOWN 565 (3) provi
- Page 587 and 588: EXPLORING THE UNKNOWN 567 Effective
- Page 589 and 590: EXPLORING THE UNKNOWN 569 [10] A br
- Page 591 and 592: EXPLORING THE UNKNOWN 571 [14] POLI
- Page 593 and 594: EXPLORING THE UNKNOWN 573 activitie
- Page 595 and 596: NASA’s technology transfer progra
- Page 597 and 598: EXPLORING THE UNKNOWN 577 Tech Brie
- Page 599 and 600: Ralph Braibanti joined the Departme
- Page 601 and 602: F Philip J. Farley (1916- ) earned
- Page 603 and 604: Lyndon B. Johnson (1908-1973) (D-TX
- Page 605 and 606: M Leonard H. Marks was one of the o
- Page 607 and 608: Robert C. Seamans, Jr. (1918- ), ha
- Page 609 and 610: Robert M. White (1923- ) served as
- Page 611 and 612: Bullington, Kenneth, 25 Bush, Georg
- Page 613 and 614: Defense Satellite Communications Sy
- Page 615 and 616: I Indiana University, 388 Initial D
- Page 617 and 618: METOP satellite series, 166 Midwest
- Page 619 and 620: O O’Connell, James D., 91-95, 99-
- Page 621 and 622: and “Long-Term Prospects for Deve
- Page 623 and 624: Reference Works, NASA SP-4000 The N
- Page 625 and 626: SP-4207 not published. Compton, W.