Artemisinin-based combination therapy for ... - The Cochrane Library
Artemisinin-based combination therapy for ... - The Cochrane Library
Artemisinin-based combination therapy for ... - The Cochrane Library

Create successful ePaper yourself
Turn your PDF publications into a flip-book with our unique Google optimized e-Paper software.
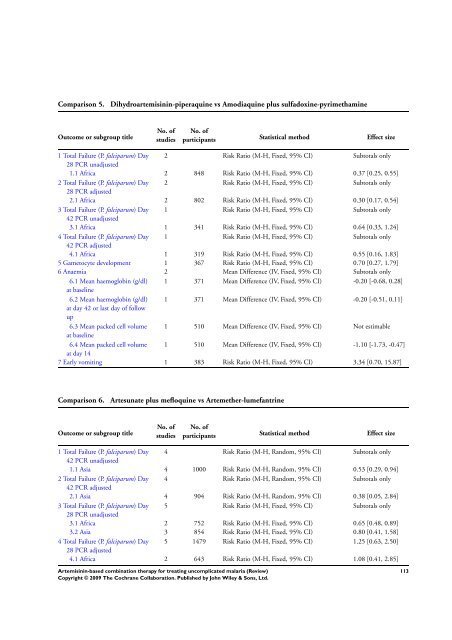
Comparison 5. Dihydroartemisinin-piperaquine vs Amodiaquine plus sulfadoxine-pyrimethamine<br />
Outcome or subgroup title<br />
No. of<br />
studies<br />
No. of<br />
participants Statistical method Effect size<br />
1 Total Failure (P. falciparum) Day<br />
28 PCR unadjusted<br />
2 Risk Ratio (M-H, Fixed, 95% CI) Subtotals only<br />
1.1 Africa 2 848 Risk Ratio (M-H, Fixed, 95% CI) 0.37 [0.25, 0.55]<br />
2 Total Failure (P. falciparum) Day<br />
28 PCR adjusted<br />
2 Risk Ratio (M-H, Fixed, 95% CI) Subtotals only<br />
2.1 Africa 2 802 Risk Ratio (M-H, Fixed, 95% CI) 0.30 [0.17, 0.54]<br />
3 Total Failure (P. falciparum) Day<br />
42 PCR unadjusted<br />
1 Risk Ratio (M-H, Fixed, 95% CI) Subtotals only<br />
3.1 Africa 1 341 Risk Ratio (M-H, Fixed, 95% CI) 0.64 [0.33, 1.24]<br />
4 Total Failure (P. falciparum) Day<br />
42 PCR adjusted<br />
1 Risk Ratio (M-H, Fixed, 95% CI) Subtotals only<br />
4.1 Africa 1 319 Risk Ratio (M-H, Fixed, 95% CI) 0.55 [0.16, 1.83]<br />
5 Gametocyte development 1 367 Risk Ratio (M-H, Fixed, 95% CI) 0.70 [0.27, 1.79]<br />
6 Anaemia 2 Mean Difference (IV, Fixed, 95% CI) Subtotals only<br />
6.1 Mean haemoglobin (g/dl)<br />
at baseline<br />
1 371 Mean Difference (IV, Fixed, 95% CI) -0.20 [-0.68, 0.28]<br />
6.2 Mean haemoglobin (g/dl)<br />
at day 42 or last day of follow<br />
up<br />
1 371 Mean Difference (IV, Fixed, 95% CI) -0.20 [-0.51, 0.11]<br />
6.3 Mean packed cell volume<br />
at baseline<br />
1 510 Mean Difference (IV, Fixed, 95% CI) Not estimable<br />
6.4 Mean packed cell volume<br />
at day 14<br />
1 510 Mean Difference (IV, Fixed, 95% CI) -1.10 [-1.73, -0.47]<br />
7 Early vomiting 1 383 Risk Ratio (M-H, Fixed, 95% CI) 3.34 [0.70, 15.87]<br />
Comparison 6. Artesunate plus mefloquine vs Artemether-lumefantrine<br />
Outcome or subgroup title<br />
No. of<br />
studies<br />
No. of<br />
participants Statistical method Effect size<br />
1 Total Failure (P. falciparum) Day<br />
42 PCR unadjusted<br />
4 Risk Ratio (M-H, Random, 95% CI) Subtotals only<br />
1.1 Asia 4 1000 Risk Ratio (M-H, Random, 95% CI) 0.53 [0.29, 0.94]<br />
2 Total Failure (P. falciparum) Day<br />
42 PCR adjusted<br />
4 Risk Ratio (M-H, Random, 95% CI) Subtotals only<br />
2.1 Asia 4 904 Risk Ratio (M-H, Random, 95% CI) 0.38 [0.05, 2.84]<br />
3 Total Failure (P. falciparum) Day<br />
28 PCR unadjusted<br />
5 Risk Ratio (M-H, Fixed, 95% CI) Subtotals only<br />
3.1 Africa 2 752 Risk Ratio (M-H, Fixed, 95% CI) 0.65 [0.48, 0.89]<br />
3.2 Asia 3 854 Risk Ratio (M-H, Fixed, 95% CI) 0.80 [0.41, 1.58]<br />
4 Total Failure (P. falciparum) Day<br />
28 PCR adjusted<br />
5 1479 Risk Ratio (M-H, Fixed, 95% CI) 1.25 [0.63, 2.50]<br />
4.1 Africa 2 643 Risk Ratio (M-H, Fixed, 95% CI) 1.08 [0.41, 2.85]<br />
<strong>Artemisinin</strong>-<strong>based</strong> <strong>combination</strong> <strong>therapy</strong> <strong>for</strong> treating uncomplicated malaria (Review)<br />
Copyright © 2009 <strong>The</strong> <strong>Cochrane</strong> Collaboration. Published by John Wiley & Sons, Ltd.<br />
113